n8n Grid Load Alert with LangChain & Supabase

n8n Grid Load Alert with LangChain & Supabase

Implement a resilient, AI-assisted grid load alert workflow in n8n that ingests incoming alerts, generates and stores semantic embeddings, retrieves historical context, and automatically logs recommended actions to Google Sheets.

1. Solution Overview

This workflow template combines n8n, LangChain, Supabase, and a large language model (LLM) to provide context-aware triage for grid or infrastructure alerts. It is designed for environments where power grids or distributed systems emit large volumes of telemetry and textual messages that must be analyzed quickly and consistently.

Using this template, you can:

  • Accept JSON alerts from external monitoring systems through an n8n Webhook
  • Split alert text into manageable chunks and generate vector embeddings
  • Persist embeddings in a Supabase vector index for long-term, semantic search
  • Query similar historical incidents based on semantic similarity
  • Provide the LLM with historical context and short-term memory to produce an action plan
  • Append structured outcomes to Google Sheets for audit, reporting, and review

The template is suitable for operators who need AI-powered incident triage while retaining full visibility into how decisions are made.

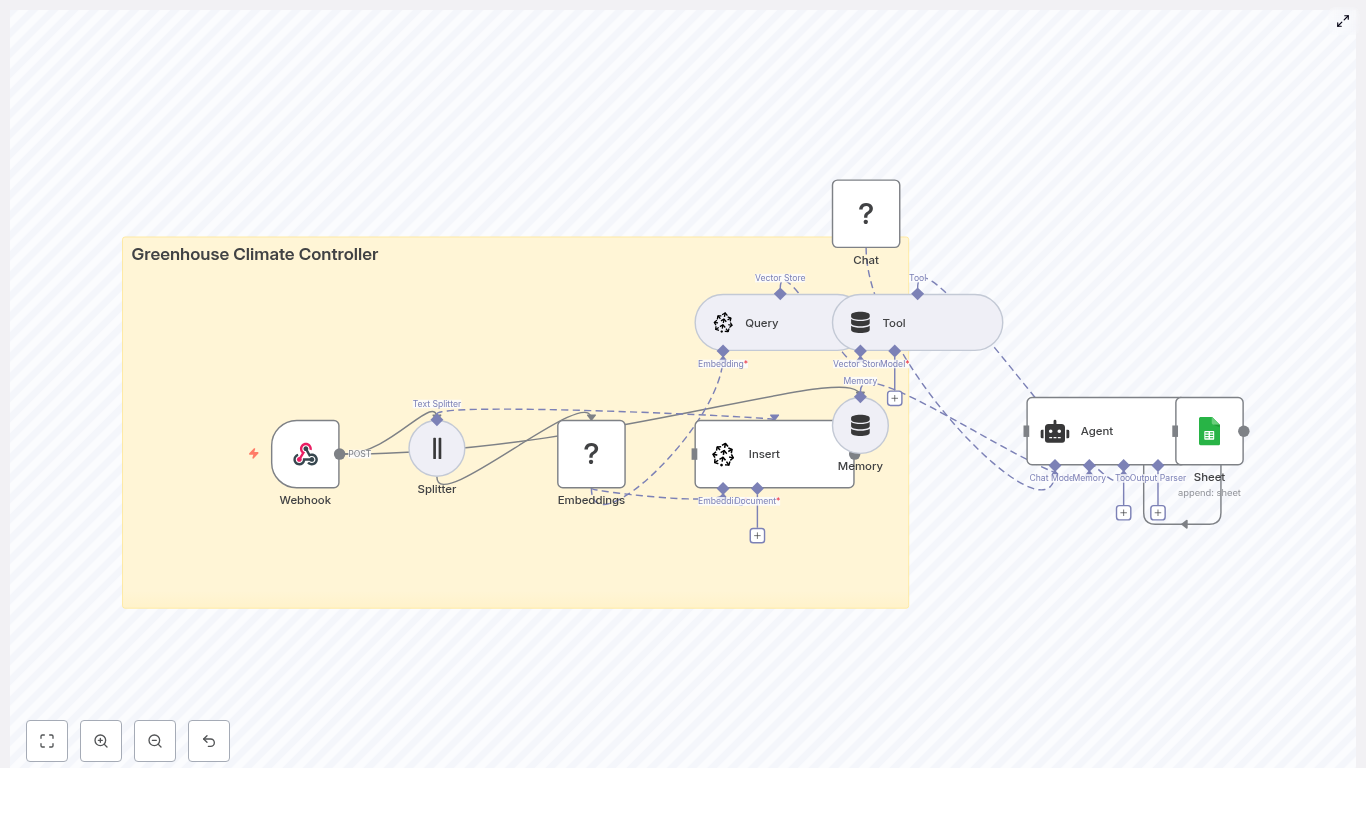
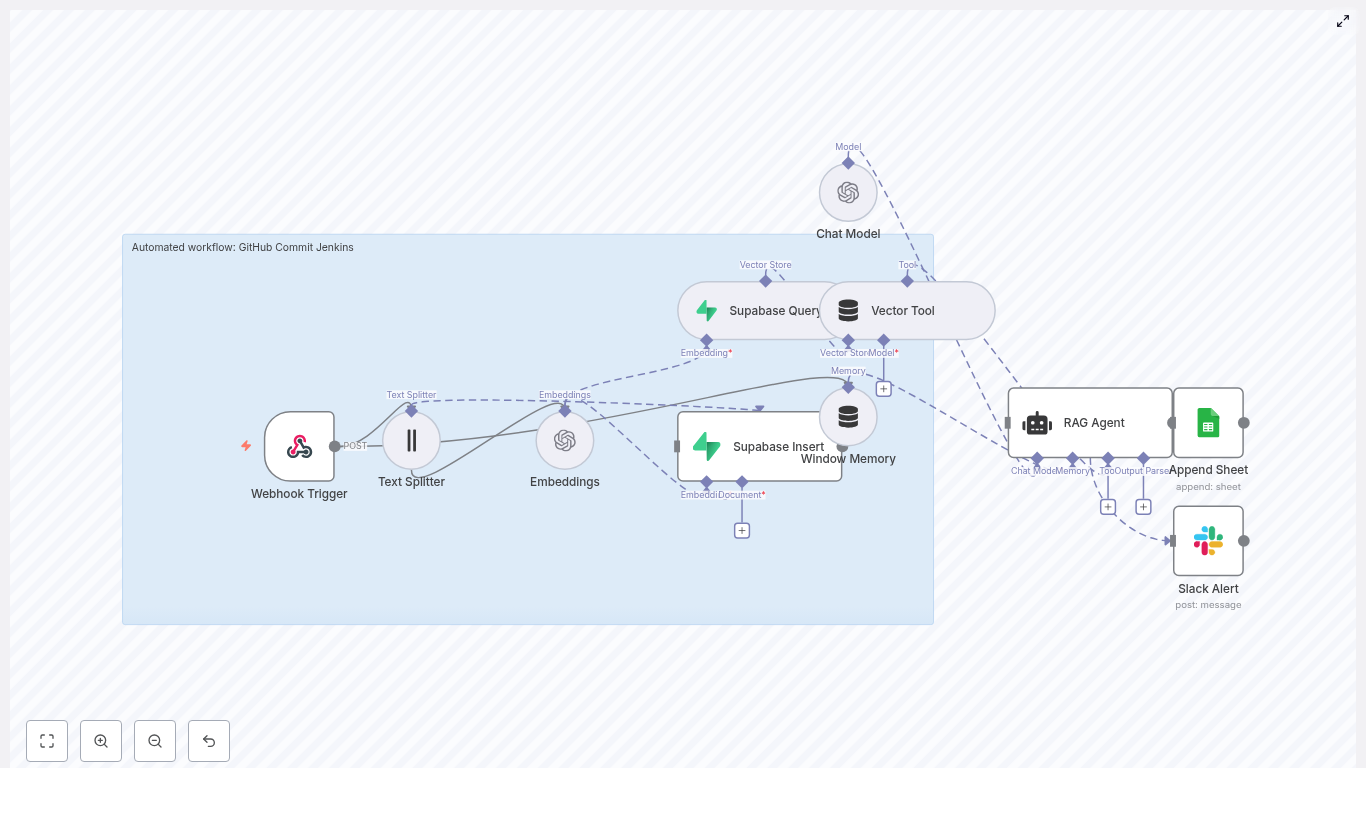
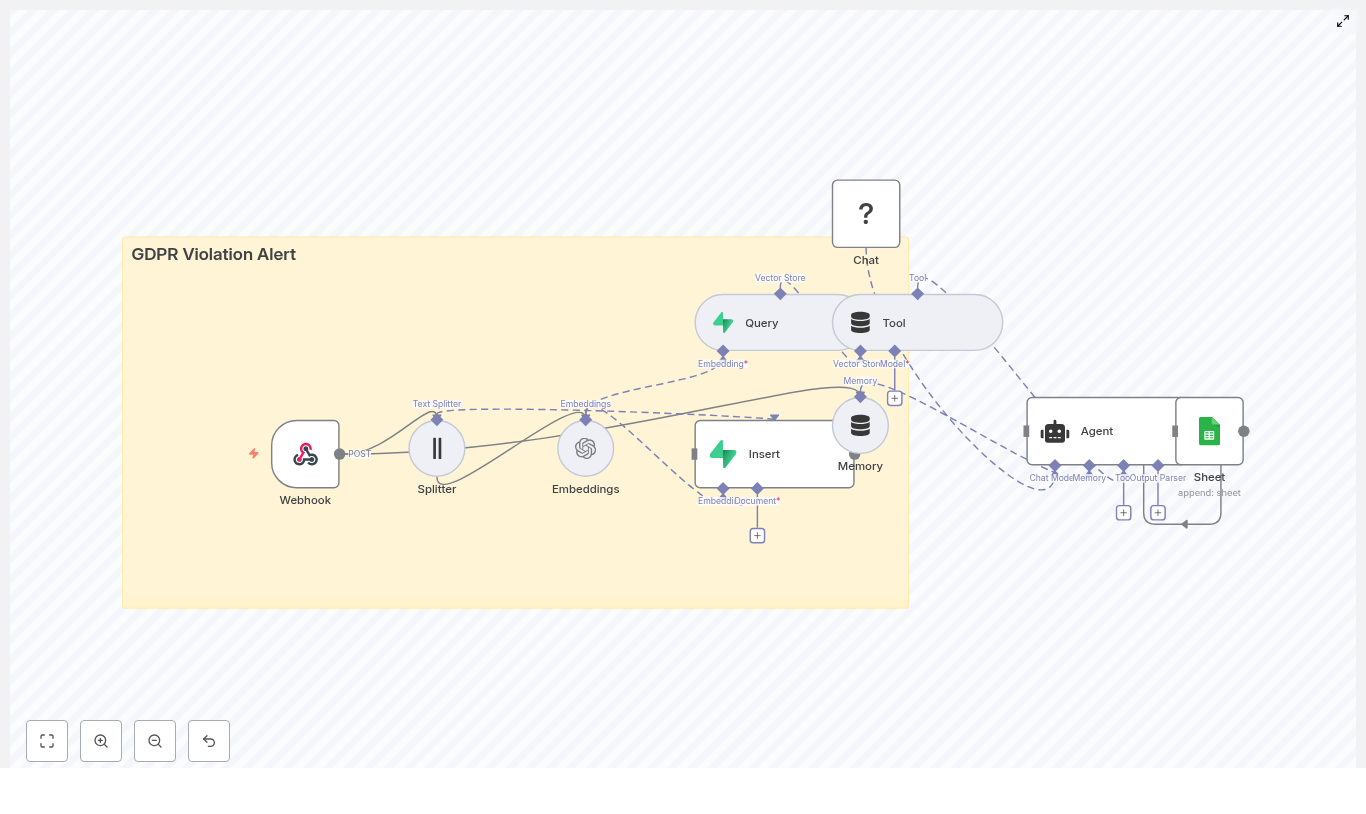
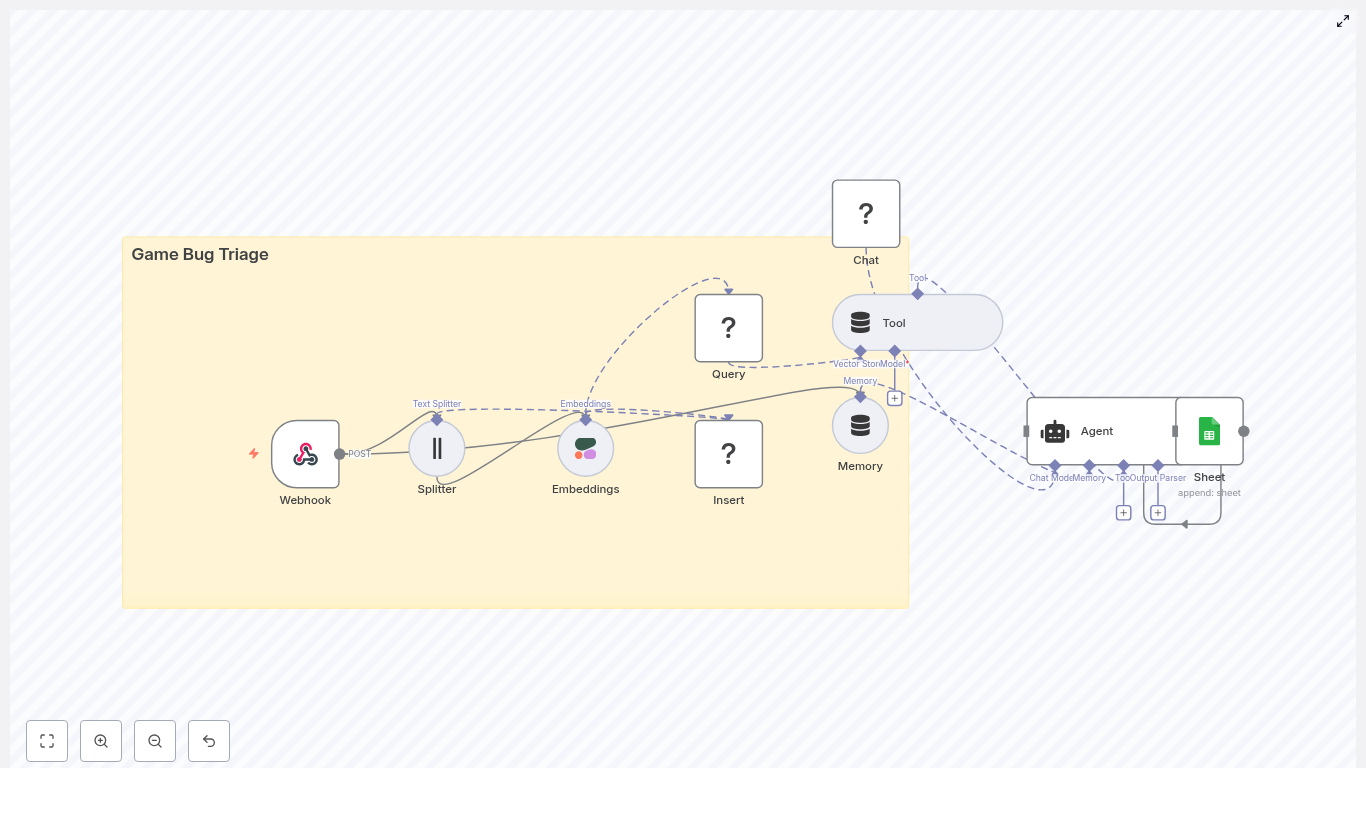
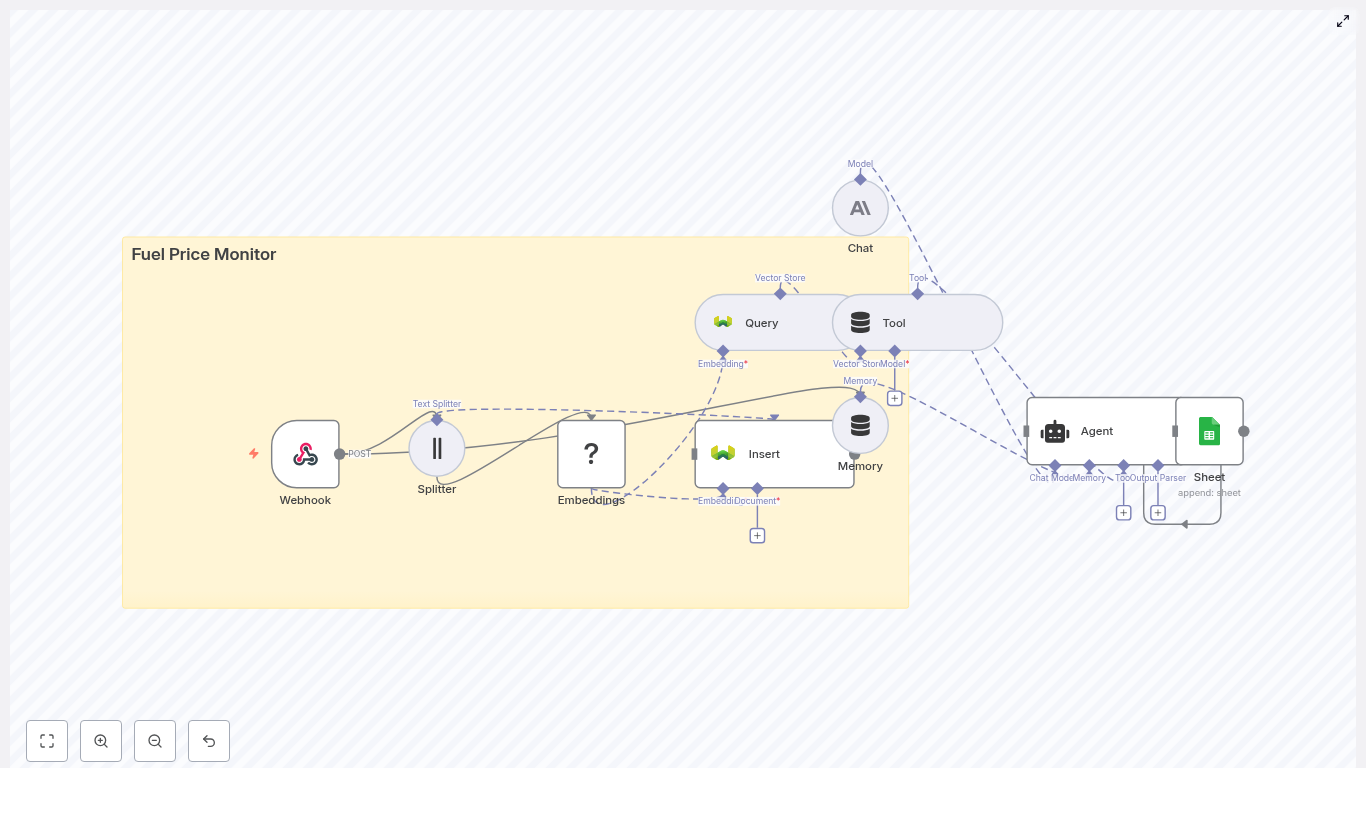
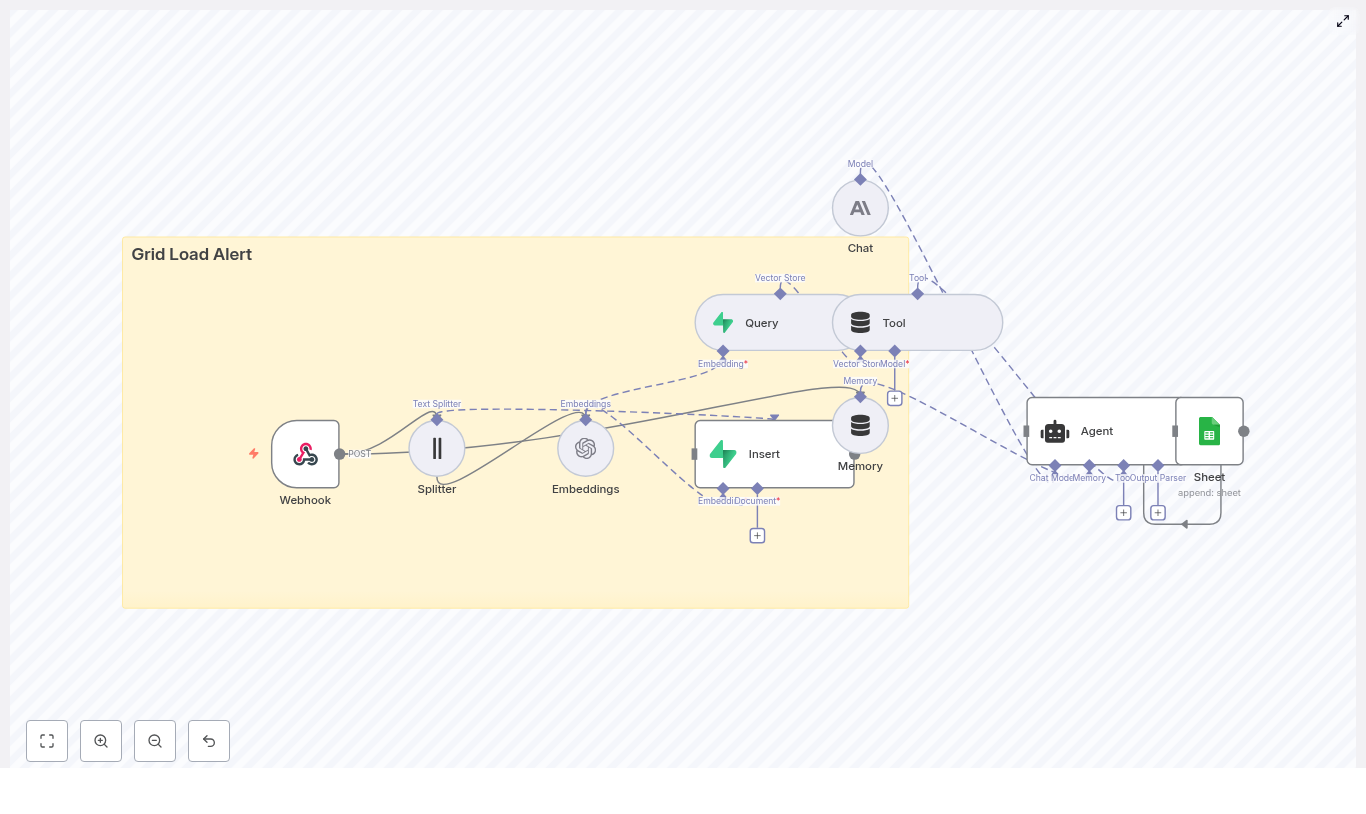
2. High-Level Architecture

The workflow is composed of several n8n nodes that map directly to LangChain tools, vector store operations, and external services.

  • Webhook (n8n) – entry point for incoming JSON alerts via HTTP POST
  • Text Splitter (LangChain Character Text Splitter) – segments alert messages into overlapping chunks
  • Embeddings (OpenAI) – converts text chunks into vector embeddings
  • Insert (Supabase vector store) – persists embeddings into the grid_load_alert index
  • Query (Supabase) – retrieves nearest neighbor vectors for a new alert
  • Tool (Vector Store Tool) – exposes the Supabase query as a LangChain tool for the Agent
  • Memory (Buffer Window) – maintains a limited conversation history for context
  • Chat (Anthropic or other LLM) – core reasoning and text generation model
  • Agent – orchestrates tool usage, memory, and reasoning to produce a final recommendation
  • Google Sheets – appends a row with the Agent’s decision and metadata

3. Data Flow and Execution Path

The workflow processes each incoming alert through the following stages:

  1. Alert ingestion
    An external system sends an HTTP POST request to the n8n Webhook at path /grid_load_alert. The request body contains JSON describing the alert.
  2. Text preprocessing
    The Webhook output is passed to the Text Splitter. The alert message field is split into chunks with:
    • chunkSize = 400
    • chunkOverlap = 40

    These values work well for descriptive grid alerts and help preserve continuity between segments.

  3. Embedding generation
    Each chunk is sent to the OpenAI Embeddings node. The node uses the selected embeddings model (template uses the OpenAI “default” embedding model) to produce numeric vectors.
  4. Vector persistence
    The embeddings are written to Supabase using the Insert node configured for a vector store. All vectors are stored in the index named grid_load_alert, together with any relevant metadata such as source, type, or timestamp.
  5. Context retrieval
    For each new alert, a Supabase Query node searches the grid_load_alert index for semantically similar vectors. It returns the top K nearest neighbors, which represent historical incidents similar to the current alert.
  6. Agent reasoning
    The Agent node receives:
    • The raw incoming alert payload (mapped as ={{ $json }} into the prompt)
    • Vector store search results exposed through the Tool node
    • Recent conversation history from the Memory node

    The Agent uses the configured LLM (via the Chat node) to synthesize this information and produce a recommended action, severity, and references.

  7. Outcome logging
    The Agent’s output is mapped into a Google Sheets node with the append operation. Each execution results in one new row that records timestamp, severity, recommended actions, and any similarity metadata.

4. Node-by-Node Breakdown

4.1 Webhook Node (Alert Ingestion)

Purpose: Receive alert payloads from external monitoring or grid management systems.

  • HTTP Method: POST
  • Path: grid_load_alert

Example payload structure:

{  "timestamp": "2025-08-31T09:12:00Z",  "source": "substation-7",  "type": "high_load",  "value": 98.6,  "message": "Transformer A nearing thermal limit. Load 98.6% for 12 minutes."
}

Ensure your external system sends valid JSON and that the message field contains the descriptive text that should be embedded and analyzed.

4.2 Text Splitter Node (LangChain Character Text Splitter)

Purpose: Break the alert message into overlapping segments suitable for embedding.

  • Recommended configuration:
  • chunkSize: 400
  • chunkOverlap: 40

This configuration helps capture enough context around key phrases without exploding the number of embeddings. For significantly longer messages, you can adjust these values, but keep overlap nonzero to avoid losing cross-boundary context.

4.3 Embeddings Node (OpenAI)

Purpose: Convert each text chunk into a vector representation.

  • Provider: OpenAI
  • Model: template uses the OpenAI “default” embedding model
  • Credentials: OpenAI API key stored in n8n credentials

Connect the Splitter output to this node. Each item in the input will generate one embedding vector. Make sure the node is configured to read the correct text property from each item.

4.4 Supabase Insert Node (Vector Store Persistence)

Purpose: Store generated embeddings in Supabase for semantic search.

  • Vector index name: grid_load_alert

The template assumes a Supabase table with a vector column (using pgvector) or usage of the Vector Store helper provided by the n8n LangChain module. Configure:

  • Supabase project URL and API key in n8n credentials
  • Table or index mapping to grid_load_alert
  • Field mapping from embedding vectors and metadata fields (for example, source, type, timestamp)

4.5 Supabase Query Node (Nearest Neighbor Search)

Purpose: Retrieve the most similar historical alerts for the current embedding.

Configuration details:

  • Use the same index or table name: grid_load_alert
  • Pass the newly computed embedding vector as the query input
  • Set top-K to control how many similar records are returned (for example, 3 to 10 neighbors)

The node returns items that include both similarity scores and any stored metadata. These results are later exposed to the Agent via the Tool node.

4.6 Vector Store Tool Node

Purpose: Expose Supabase query capabilities as a LangChain Tool that the Agent can call during reasoning.

This node wraps the vector store operations so that the Agent can request similar incidents as needed. The Agent does not need to know about Supabase directly, only that a “vector store tool” is available.

4.7 Memory Node (Buffer Window)

Purpose: Maintain a short rolling window of previous interactions and Agent outputs.

The Buffer Window Memory node stores recent messages and tool calls. This helps the Agent avoid repeating work and allows it to reference earlier steps in the same workflow execution. Keep the window relatively small for high-throughput alerting scenarios to control token usage.

4.8 Chat Node (LLM Configuration)

Purpose: Provide the base large language model for the Agent.

  • Typical provider: Anthropic (as per template) or another supported LLM
  • Role: Executes the reasoning and text generation based on prompts, memory, and tool outputs

Configure the Chat node with your chosen model, temperature, and other generation parameters. Connect it to your Anthropic (or equivalent) credentials in n8n.

4.9 Agent Node (Orchestration and Reasoning)

Purpose: Coordinate tool calls, memory, and LLM reasoning to produce a final, structured response.

  • Prompt type: define
  • Prompt input: the node maps ={{ $json }} to pass the raw incoming alert fields into the Agent prompt

Within the Agent configuration, you can:

  • Reference the vector store tool so the Agent can fetch similar incidents
  • Attach the Buffer Window Memory for short-term context
  • Customize the system and user prompts to encode severity rules, escalation criteria, and output format

4.10 Google Sheets Node (Outcome Logging)

Purpose: Persist the Agent’s decision and metadata in a structured, easily accessible format.

  • Operation: append
  • sheetName: Log
  • documentId: your target Google Sheets spreadsheet ID

Typical fields to map from the Agent output and alert payload include:

  • timestamp
  • source
  • type
  • value
  • computed severity
  • recommended action(s)
  • similarity matches or incident references
  • source alert ID or URL

5. Step-by-Step Configuration Guide

5.1 Configure the Webhook

  1. Add a Webhook node.
  2. Set HTTP Method to POST.
  3. Set Path to grid_load_alert.
  4. Save the workflow and copy the Webhook URL for your monitoring system.

Example JSON that the external system should send:

{  "id": "alert-2025-0001",  "timestamp": "2025-08-31T09:12:00Z",  "source": "region-east/substation-7",  "type": "high_load",  "value": 98.6,  "message": "Transformer A nearing thermal threshold. Load sustained above 95% for 12 minutes."
}

5.2 Add and Configure the Text Splitter

  1. Add a LangChain Character Text Splitter node.
  2. Connect it to the Webhook node.
  3. Set:
    • chunkSize = 400
    • chunkOverlap = 40
  4. Ensure the node uses the correct field (for example, message) as the input text.

5.3 Generate Embeddings with OpenAI

  1. Add an OpenAI Embeddings node.
  2. Connect it to the Text Splitter node.
  3. Select the embeddings model (template uses the “default” OpenAI embeddings model).
  4. Attach your OpenAI credential from n8n.

5.4 Persist Embeddings in Supabase

  1. Add a Supabase Insert node configured as a vector store operation.
  2. Connect it to the Embeddings node.
  3. Set the vector index or table name to grid_load_alert.
  4. Ensure Supabase is configured with:
    • A table that includes a pgvector column for embeddings
    • Additional columns for metadata if required
  5. Provide Supabase URL and API key via n8n credentials.

5.5 Retrieve Similar Historical Alerts

  1. Add a Supabase Query node.
  2. Connect it so that it receives the new alert’s embedding.
  3. Configure it to search the grid_load_alert index.
  4. Set the number of neighbors to retrieve (top-K), for example between 3 and 10.

5.6 Configure Tool, Memory, Chat, and Agent

  • Tool node:
    • Create a Vector Store Tool node that wraps the Supabase Query.
    • Expose it as a tool the Agent can call to look up similar incidents.
  • Memory node:
    • Add a Buffer Window Memory node.
    • Connect it to the Agent so recent exchanges are stored and reused.
  • Chat node:
    • Add a Chat node and select Anthropic or another LLM provider.
    • Configure model parameters such as temperature and max tokens as appropriate.
  • Agent node:
    • Set the prompt type to define.
    • Map the incoming alert JSON into the prompt using ={{ $json }}.
    • Attach the Chat node as the LLM.
    • Attach the Tool node so the Agent can query the vector store.
    • Attach the Memory node to provide a short history window.
    • Customize the prompt text to encode business rules, severity thresholds, and escalation policies.

5.7 Log Results to Google Sheets

Greenhouse Climate Controller with n8n & AI

Greenhouse Climate Controller with n8n & AI

Imagine your greenhouse looking after itself. Sensors quietly send data, an AI checks what has happened in the past, compares it with your notes and best practices, then calmly decides what to do next. That is exactly what this n8n workflow template helps you build.

In this guide, we will walk through how to set up a smart greenhouse climate controller using:

  • n8n for low-code automation
  • Hugging Face embeddings for semantic understanding
  • Pinecone as a vector store for historical context
  • A LangChain-style agent for decision making
  • Google Sheets for logging and traceability

We will cover what the template does, when it is worth using, and how to set it up step by step so you can move from basic rules to context-aware decisions.

What this n8n greenhouse template actually does

At a high level, this workflow listens to sensor data, turns your logs and notes into embeddings, stores them in Pinecone, then uses an AI agent to make decisions based on both live readings and historical patterns. Every decision gets logged to Google Sheets so you can review, audit, or improve it later.

Here is the flow in plain language:

  1. Greenhouse sensors (or a scheduler) send a POST request to an n8n Webhook.
  2. Relevant text (notes, logs, combined data) is split into chunks.
  3. Each chunk is converted into vector embeddings using Hugging Face.
  4. Those embeddings are stored in a Pinecone index called greenhouse_climate_controller.
  5. When new sensor data arrives, the workflow queries Pinecone for similar past events and documentation.
  6. An AI agent, powered by a language model, uses that context plus short-term memory to decide what to do.
  7. The final recommendation and raw sensor payload are appended to a Google Sheet for record keeping.

Why combine n8n, embeddings, and a vector store?

Most greenhouse automations are rule-based. You set thresholds like:

  • If humidity > 80%, open vent.
  • If temperature < 18°C, turn on heater.

That is fine for simple setups, but it ignores rich context like:

  • Past mold issues in a specific corner
  • Maintenance notes and SOPs (standard operating procedures)
  • Patterns that only become obvious over time

By adding embeddings and a vector store, you give your automation a way to search through all that unstructured information semantically, not just by keywords. The agent can then reason over that context and make smarter decisions.

Key benefits

  • Context-aware decisions – The agent can look at historical events, notes, and documentation before recommending actions.
  • Fast semantic search – Vector similarity search lets you quickly find relevant logs and SOPs, even if wording is different.
  • Low-code orchestration with n8n – Easily connect sensors, APIs, and tools without writing a full backend.
  • Persistent logging – Google Sheets keeps a clear, human-readable trail of what happened and why.

In practice, this means your system can do things like: “We have high humidity and condensation on the north wall again. Last time this happened, mold developed within a week when ventilation was not increased enough. Let us open the vents a bit more and recommend a manual inspection.”

When should you use this template?

This workflow is a good fit if:

  • You already have (or plan to have) greenhouse sensors sending data.
  • You are tired of hard-coded rules that do not adapt to real-world behavior.
  • You keep logs, notes, or SOPs and want your automation to actually use them.
  • You want an audit trail of why each decision was made.

If you are just starting with automation, you can still use this template as a “smart layer” on top of simpler controls, then gradually lean more on the AI agent as you gain confidence.

Core building blocks of the workflow

Let us break down the main n8n nodes and what each one is responsible for.

Webhook – entry point for sensor data

The Webhook node receives incoming POST requests with sensor payloads, such as:

  • Temperature
  • Humidity
  • CO2 levels
  • Current actuator states (vents, heaters, etc.)
  • Optional notes or observations

Example Webhook configuration

  • Method: POST
  • Path: /greenhouse_climate_controller

Example JSON payload

{  "device_id": "greenhouse-01",  "timestamp": "2025-08-31T09:40:00Z",  "temperature": 26.8,  "humidity": 82,  "co2": 420,  "actuators": {"vent": "closed", "heater": "off"},  "notes": "heavy condensation on North wall"
}

Text Splitter – preparing data for embeddings

Long messages or combined logs are not ideal for embeddings directly. The Text Splitter node breaks them into manageable, semantically coherent chunks.

A typical configuration might be:

  • chunkSize = 400
  • chunkOverlap = 40

This overlap helps preserve context across chunks and improves embedding quality.

Embeddings (Hugging Face) – turning text into vectors

Next, the Hugging Face embeddings node converts each text chunk into a vector representation. You will need:

  • A Hugging Face API key
  • A suitable model for semantic understanding of short text, logs, and notes

These embeddings are what allow the vector store to perform semantic similarity searches later.

Pinecone Insert – storing your greenhouse memory

The Insert node pushes each embedding into a Pinecone index. In this workflow, the index is named greenhouse_climate_controller.

Along with the vector, include rich metadata, for example:

  • device_id
  • timestamp
  • Sensor types or values
  • Original text or note

This metadata is extremely useful later for filtering, debugging, and interpretation.

Pinecone Query + Vector Store Tool – retrieving context

Whenever a new payload comes in, the workflow creates a short “context query” that describes the current situation, for example:

high humidity and condensation in north wall, temp=26.8, humidity=82

The Query node then searches the greenhouse_climate_controller index for similar past events and relevant documentation or SOP snippets.

The results are exposed to the agent through a Vector Store Tool, which the agent can call when it needs more context. This is how the agent “looks up” historical patterns instead of guessing in isolation.

Memory – keeping short-term context

The Memory node maintains a short buffer of recent interactions. This lets the agent remember what happened in the last few runs, which can be helpful if you have multi-step processes or want to track evolving conditions.

Chat / Agent (LM via Hugging Face) – making the decision

The Agent node is where everything comes together. It receives:

  • Raw sensor data from the Webhook
  • Relevant context from the vector store tool
  • Short-term memory from the Memory node

Using a language model (via Hugging Face), the agent synthesizes a recommendation. Typical outputs might include:

  • “Open vents 30% for 15 minutes.”
  • “Start heater on low to reduce relative humidity.”
  • “Repeated condensation on north wall, recommend manual inspection.”

To keep things reliable, you will want to carefully design the agent prompt with:

  • Clear role instructions (safety, thresholds, actionability)
  • A description of the vector tool and how to use it
  • A structured output format that is easy to parse and log

Google Sheets – logging for traceability

Finally, the Sheet node appends a new row to a Google Sheet that acts as your logbook. Typical fields might include:

  • Timestamp
  • Device ID
  • Sensor values
  • Agent action
  • Reason and confidence
  • Relevant Pinecone result IDs

This log is invaluable for audits, debugging, and improving your prompts or models later. It also gives you data you can use for supervised fine-tuning down the road.

Step-by-step: building the workflow in n8n

1. Set up the Webhook

In n8n, add a Webhook node:

  • Method: POST
  • Path: /greenhouse_climate_controller

Point your sensors or gateway to this URL and send JSON payloads similar to the example above. This is your main ingestion point.

2. Split incoming text or logs

Add a Text Splitter node to handle long notes or combined logs. Configure it with something like:

  • chunkSize = 400
  • chunkOverlap = 40

This ensures your embeddings are based on coherent slices of text instead of one giant blob.

3. Generate embeddings with Hugging Face

Next, drop in a Hugging Face Embeddings node and connect it to the Text Splitter. Configure:

  • model = your-HF-model (choose one suited for semantic similarity)
  • credentials = HF_API (your Hugging Face API key)

Each text chunk will now be converted into a vector representation.

4. Insert embeddings into Pinecone

Add a Pinecone Insert node and configure it as follows:

  • mode = insert
  • indexName = greenhouse_climate_controller

Along with the vector, attach metadata like:

  • device_id
  • timestamp
  • Sensor-type info
  • Original text

This creates your long-term memory of greenhouse events.

5. Query the vector store for similar situations

For each new sensor payload, build a short, descriptive query string that captures the current state (for example “high humidity and condensation in north wall”).

Use a Pinecone Query node configured with:

  • indexName = greenhouse_climate_controller

The query results are then wrapped as a Tool (Vector Store) node that the agent can call to fetch relevant past events and SOP snippets.

6. Configure the agent and memory

Add a Memory node to keep a small buffer of recent context, then connect it and the Vector Store Tool to a Chat/Agent node, for example using lmChatHf as the language model.

In the agent configuration:

  • Define its role, for example “You are an automation agent for a greenhouse climate controller.”
  • Explain what the vector tool provides and when to use it.
  • Specify a strict, machine-readable output format.

Designing the agent prompt and output format

A well-structured prompt makes your workflow far more reliable. You want the agent to be predictable and easy to parse programmatically.

Here is a simple example prompt snippet:

You are an automation agent for a greenhouse climate controller.
Given sensor data and relevant historical context, output JSON with fields: action, reason, confidence (0-1), notes.

And an example of the kind of JSON you might expect back:

{  "action": {"vent_open_pct": 30, "duration_min": 15},  "reason": "High humidity (82%) with condensation observed; similar past events led to mold when ventilation was insufficient.",  "confidence": 0.87,  "notes": "Recommend manual wall inspection after ventilation cycle."
}

Because the output is structured, you can safely parse it in n8n, log it, and even trigger downstream actions (like controlling actuators) without guesswork.

7. Log everything to Google Sheets

Last step: add a Google Sheets node configured to append rows to a “Log” sheet using OAuth2.

Typical configuration:

  • Operation: Append
  • Target: your greenhouse log sheet

Write fields such as:

  • Raw sensor payload
  • Agent decision (parsed JSON)
  • Reason and confidence
  • Pinecone match IDs or scores

This gives you a complete, human-friendly history of how your greenhouse AI behaved over time.

Quick reference: n8n node mapping

  • Webhook: POST /greenhouse_climate_controller
  • Splitter: chunkSize = 400, chunkOverlap = 40
  • Embeddings: model = your-HF-model, credentials = HF_API
  • Insert: mode = insert, indexName = greenhouse_climate_controller (Pinecone)
  • Query: indexName = greenhouse_climate_controller
  • Tool: name = Pinecone (vector store wrapper)
  • Memory: buffer window for short-term context
  • Chat/Agent: lmChatHf + agent node to run decision logic
  • Sheet: append row to “Log” sheet (Google Sheets OAuth2)

Operational considerations

Security

  • Protect the Webhook with IP allowlists, HMAC signatures, or an API key.
  • Store all secrets in n8n credentials and limit who can access the UI.

Costs and rate limits

  • Embedding generation and Pinecone storage both incur usage costs, so batch and deduplicate inputs when you can.
  • Consider caching frequent queries and only hitting Pinecone for non-trivial or anomalous events.

Scaling

  • Run n8n with autoscaling if you expect high sensor event volume.
  • Use Pinecone sharding and capacity settings to meet your latency and throughput needs.

Troubleshooting and tuning tips

  • If search results feel irrelevant, try increasing chunk overlap and double-check your embedding model choice.
  • If the agent output is vague, tighten the prompt, add clearer constraints, and enforce structured JSON output.
  • Include rich metadata (device_id, zone, sensor_type) when inserting embeddings so you can filter and debug more easily.

Ideas for next-level enhancements

Once the basic workflow is stable, you can start layering on more advanced features:

Automated Grant Application Routing with n8n & RAG

Automated Grant Application Routing with n8n & RAG

Grant programs have the power to unlock innovation, support communities, and fuel growth. Yet behind every successful grant initiative is a mountain of applications that someone has to review, categorize, and route. At scale, this work can feel overwhelming, repetitive, and vulnerable to human error.

If you have ever stared at a backlog of grant submissions and thought, “There has to be a better way,” this guide is for you.

In this article, you will walk through a complete journey: from the pain of manual triage to the possibility of intelligent automation, and finally to a practical, ready-to-use n8n workflow template that uses RAG (Retrieval-Augmented Generation), OpenAI embeddings, Supabase vector storage, and LangChain tools to route, summarize, and log incoming applications.

Think of this template as a starting point, not a finished destination. It is a foundation you can build on, customize, and expand as your grant operations grow.


The problem: manual routing slows down impact

Nonprofits, research offices, and grant-making teams often share the same challenges:

  • Applications arrive from multiple forms, portals, or systems.
  • Staff spend hours reading, tagging, and routing each submission.
  • Important details can be missed or inconsistently categorized.
  • Reviewers struggle to find context or past similar applications.

As volume grows, this manual approach does not just cost time, it delays decisions, slows funding, and limits the impact your organization can have.

Automation is not about replacing your expertise. It is about freeing you and your team from repetitive triage so you can focus on what truly matters: evaluating quality, supporting applicants, and driving outcomes.


The mindset shift: from reactive to proactive with automation

Before diving into nodes and configuration, it helps to adopt a different mindset. Instead of asking, “How do I keep up with all these applications?” start asking, “How can I design a system that does the heavy lifting for me?”

With n8n and a RAG-powered workflow, you can:

  • Turn every incoming application into structured, searchable data.
  • Automatically suggest routing decisions with rationale and confidence scores.
  • Log results in tools your team already uses, like Google Sheets and Slack.
  • Continuously refine the workflow as you learn what works best.

Instead of reacting to a flood of submissions, you build a proactive, always-on assistant that learns from your data and supports your process every day.


The vision: an intelligent routing pipeline with n8n & RAG

The workflow you are about to explore is built on top of n8n, OpenAI, Supabase, and LangChain. At a high level, it works like this:

  • Webhook Trigger receives incoming grant application payloads.
  • Text Splitter breaks long application text into manageable chunks.
  • Embeddings (OpenAI) converts those chunks into vector embeddings.
  • Supabase Insert stores embeddings and metadata in a vector index.
  • Supabase Query + Vector Tool retrieves relevant context for the RAG agent.
  • Window Memory maintains short-term context for the agent’s reasoning.
  • Chat Model (OpenAI) powers the language understanding and generation.
  • RAG Agent summarizes the application and decides where it should go.
  • Append Sheet records all outputs in Google Sheets.
  • Slack Alert notifies your team when something goes wrong.

This is not a theoretical diagram. It is a working, reusable n8n template you can plug into your stack and adapt to your own grant programs.


Step-by-step journey: building the workflow in n8n

Let’s walk through each piece of the workflow. As you follow along, imagine how you might customize each part for your own application forms, review process, or internal tools.

1. Receive applications with a Webhook Trigger

Your journey starts with a simple entry point: an HTTP POST webhook.

Create a Webhook node in n8n and configure it as:

  • HTTP Method: POST
  • Path: /grant-application-routing

External forms or APIs can now send application JSON directly into n8n. This might be a custom form on your website, a submission portal, or another system in your stack.

Protect this gateway. Use a shared secret header, IP allowlisting, or network-level validation so only trusted sources can send data into your workflow.

2. Prepare the text with a Text Splitter

Grant applications are often long and detailed. To make them usable for embeddings and retrieval, you split them into smaller, overlapping chunks.

Add a Text Splitter node and configure it with approximately:

  • Chunk size: 400 characters
  • Chunk overlap: 40 characters

This overlap preserves context across boundaries so the meaning of the text remains intact when you later search or reconstruct it. It is a small detail that makes your RAG agent more accurate and reliable.

3. Turn text into vectors with OpenAI Embeddings

Next, you transform each chunk of text into a vector representation. This is what allows your workflow to search and compare text semantically instead of relying on simple keyword matching.

Add an Embeddings node and select an OpenAI embedding model optimized for this task, such as text-embedding-3-small.

For each chunk, store useful metadata alongside the embedding, for example:

  • Application ID
  • Chunk index
  • Original text

This metadata will later help you trace back decisions, debug issues, or rebuild context for reviewers.

4. Store context in Supabase as a vector index

Now you need a place to keep those embeddings so they can be searched efficiently. Supabase provides a managed vector store that integrates nicely with SQL-based querying.

Add a Supabase Insert node and point it to a vector index, for example:

  • Index name: grant_application_routing

Insert each embedding along with its metadata and original chunk. Over time, this index becomes a rich knowledge base of your grant applications, policies, and related documents that your RAG agent can learn from.

5. Retrieve relevant context with Supabase Query + Vector Tool

When a new application is processed, the agent should not work in isolation. It should be able to look up similar past cases, policy excerpts, or any stored context that might inform routing decisions.

Use a Supabase Query node together with a Vector Tool node to:

  • Query the vector store for nearest neighbors to the incoming text.
  • Expose the retrieved documents as a tool that the RAG agent can call when needed.

This step turns your Supabase index into a dynamic knowledge source for the agent, so it can reference past applications or internal guidelines while making decisions.

6. Maintain short-term context with Window Memory

Complex applications may involve multiple pieces of text or related messages. To help the agent reason across them, you add a memory component.

Use a Window Memory node to maintain a short-term buffer of recent messages and context. Configure the memory size to balance two goals:

  • Enough context for the agent to understand the full picture.
  • Controlled cost so you are not sending excessive text to the model.

This memory makes the agent feel more coherent and “aware” of the current application flow.

7. Combine Chat Model and RAG Agent for intelligent routing

Now you are ready to bring everything together. The RAG agent is the brain of your workflow, powered by an OpenAI chat model and connected to your vector tools and memory.

Add a Chat Model node and configure it to use an appropriate OpenAI chat model for your needs. Then connect it to a RAG Agent node that orchestrates:

  • Incoming application data.
  • Vector Tool calls to Supabase for context.
  • Window Memory for recent conversation history.

Use a focused system message to set expectations, for example:

You are an assistant for Grant Application Routing.

Then design a prompt template that instructs the agent to:

  • Summarize key application fields, such as project summary, budget, and timeline.
  • Assign a routing decision, for example Program A, Review Committee B, or Reject for incomplete.
  • Provide a short rationale and a confidence score.

This is where your process knowledge shines. You can refine the prompt over time to match your organization’s language, categories, and decision logic.

8. Log every decision in Google Sheets with Append Sheet

Automation is powerful, but only if you can see and audit what it is doing. To keep everything transparent, you log the agent’s output to a central spreadsheet.

Add an Append Sheet node for Google Sheets and map columns such as:

  • Application ID
  • Routing decision
  • Summary
  • Raw RAG response or notes

This gives coordinators and reviewers a simple, familiar view of what the workflow is doing. They can spot check results, override decisions, and use the data to refine prompts or routing rules.

9. Protect your workflow with Slack error alerts

Even the best workflows occasionally hit errors. Instead of silently failing, your automation should actively ask for help.

Connect the onError output of the RAG Agent node to a Slack node configured as an alert channel. When something goes wrong, send a message to a dedicated #alerts channel that includes:

  • A brief description of the error.
  • Optional stack traces or identifiers for debugging.

This keeps your engineering or operations team in the loop so they can quickly triage issues and keep the pipeline healthy.


Configuration and security: building on a solid foundation

As your workflow becomes a critical part of your grant operations, security and reliability matter more than ever. Keep these practices in mind:

  • Secrets management: Store all API keys (OpenAI, Supabase, Google, Slack) in n8n credentials, not directly in nodes or code.
  • Input validation: Validate the webhook payload schema so malformed or incomplete applications do not break the pipeline.
  • Rate limiting: Batch or throttle embedding requests to manage OpenAI costs and avoid hitting rate limits.
  • Access control: Use dedicated service accounts for Google Sheets and Supabase, with write access restricted to this workflow.
  • Monitoring: Combine Slack alerts with n8n execution logs to track failure rates and overall performance.

These guardrails help your automation stay dependable as you scale.


Scaling and cost: growing smart, not just big

Embedding and model calls are typically the main cost drivers in a RAG-based workflow. With a few thoughtful choices, you can scale efficiently.

  • Embed only what matters: Focus on the fields that influence routing or review. Avoid embedding large binary data or repeated boilerplate text.
  • Use tiered models: Rely on smaller, cheaper embedding models for indexing, and call higher quality models only when you need deeper summarization or analysis.
  • Cache and optimize queries: Cache frequent Supabase queries and keep a compact memory window to reduce repeated calls.

By tuning these levers, you keep your workflow sustainable and ready to handle growing application volumes.


Testing and validation: building trust in your automation

Before you rely on the workflow for live grant cycles, take time to test and validate. This stage is where you build confidence, both for yourself and for your team.

Run end-to-end tests with real or representative application samples and confirm that:

  1. The entire pipeline executes without errors from webhook to Google Sheets.
  2. Routing decisions align with expected labels or your existing manual process.
  3. Summaries capture the essential fields reviewers need for intake.

Use what you learn to refine prompts, adjust thresholds, or tweak routing logic. Each iteration makes the workflow more aligned with your real-world needs.


Example prompts to guide your RAG Agent

Clear, structured prompts help your RAG agent produce consistent, actionable outputs. Here is a simple starting point you can adapt:

System: You are an assistant for Grant Application Routing. 
Extract the project summary, funding amount requested, key timelines, 
and assign a routing decision.

User: Process the following application data: {{application_text}}. 
Return JSON with keys: routing_decision, confidence (0-1), summary, notes.

As you gain experience, you can refine this prompt with your own categories, risk flags, or eligibility checks.


Your next step: turn this template into your automated ally

You now have a complete picture of how this n8n-based workflow works, from raw application text to routed decisions, summaries, and logs. More importantly, you have a starting point for transforming how your organization handles grant applications.

This pipeline combines Webhooks, OpenAI embeddings, Supabase vector storage, LangChain tools, and a RAG agent into a scalable, auditable foundation for automated grant application routing. It reduces manual triage, creates searchable context for reviewers, and gives you space to focus on strategy and impact instead of repetitive sorting.

Do not feel pressure to make it perfect on day one. Start small, connect your data, run test payloads, and improve as you go. Each iteration is an investment in a more focused, automated workflow.

Call to action: experiment, adapt, and grow with n8n

Ready to see this in action?

Import the n8n template, connect your OpenAI and Supabase accounts, and send a few sample grant applications through the workflow. Watch how they are summarized, routed, and logged. Then adjust prompts, categories, or thresholds until it feels like a natural extension of your team.

If you want a deeper walkthrough or a tailored implementation plan, reach out to our team. Use this template as your stepping stone toward a more automated, focused, and impactful grant review process.

Automate GitHub → Jenkins with n8n & Supabase

Automate GitHub → Jenkins with n8n & Supabase

Ever pushed a commit and then spent the next ten minutes clicking around like a DevOps intern on loop? Trigger Jenkins, update a sheet, check logs, ping Slack, repeat. It is like Groundhog Day, but with more YAML.

This guide walks you through an n8n workflow template that does all that busywork for you. It listens to GitHub commits, generates embeddings, stores and queries vectors in Supabase, runs a RAG agent with OpenAI for context-aware processing, logs results to Google Sheets, and even yells in Slack when something breaks. You get a production-ready CI/CD automation pipeline that is smart, traceable, and way less annoying than doing it all by hand.

What this n8n workflow actually does (and why you will love it)

At a high level, this template turns a simple GitHub push into a fully automated, context-aware flow:

  • Webhook Trigger catches GitHub commit events.
  • Text Splitter slices long commit messages or payloads into chunks.
  • OpenAI Embeddings converts those chunks into vectors using text-embedding-3-small.
  • Supabase Insert stores chunks and embeddings in a Supabase vector index.
  • Supabase Query + Vector Tool performs similarity search to pull relevant context.
  • Window Memory & Chat Model give the RAG agent short-term memory and an LLM brain.
  • RAG Agent combines tools, memory, and the model to produce contextual output.
  • Append Sheet writes everything to Google Sheets for auditing and reporting.
  • Slack Alert shouts into a channel when errors or important statuses appear.

The result is a GitHub-to-Jenkins automation that is not just a dumb trigger, but an intelligent layer that can:

  • Generate release notes from commits.
  • Run semantic checks for security or policy issues.
  • Feed Jenkins or other CI jobs with rich, contextual data.
  • Keep non-technical stakeholders informed with friendly summaries.

Why use n8n, Jenkins, and Supabase together?

Modern DevOps is less about “can we automate this” and more about “why are we still doing this manually.” By wiring GitHub → n8n → Jenkins + Supabase + OpenAI, you get:

  • Visual orchestration with n8n, so you can see and tweak the workflow without spelunking through scripts.
  • Semantic search and RAG reasoning by storing embeddings in Supabase and using OpenAI to interpret them.
  • Faster feedback loops, since every push can be enriched, checked, logged, and acted on automatically.
  • Better observability with Google Sheets logs and Slack alerts when something goes sideways.

In short, you get a smarter, more resilient CI/CD automation pipeline that saves time and sanity.

Quick setup: from template to running workflow

Here is the short version of how to get this n8n template running without rage-quitting:

  1. Import the template
    Clone the provided n8n template JSON and import it into your n8n instance.
  2. Create required credentials
    Set up and configure:
    • OpenAI API key
    • Supabase account and API keys
    • Google Sheets OAuth credentials
    • Slack API token

    Store all of these in n8n credentials, not hard-coded in nodes.

  3. Expose your n8n webhook
    Deploy a public n8n endpoint or use a tunneling tool like ngrok for testing. Make sure GitHub can reach your webhook URL.
  4. Configure the GitHub webhook
    In your GitHub repo go to Settings → Webhooks and:
    • Point the webhook to your n8n URL + path, for example https://your-n8n-url/webhook/github-commit-jenkins.
    • Set the method to POST.
    • Filter events to push or any other events you want to handle.
  5. Tune text chunking
    Adjust the Text Splitter chunk size to match your typical commit messages or diffs.
  6. Validate Supabase vector storage
    Confirm that inserts and queries work as expected and that similarity search returns relevant chunks.
  7. Customize the RAG prompts
    Tailor the RAG agent’s system and task prompts to your use case, like:
    • Release note generation
    • Triggering Jenkins jobs
    • Compliance or security checks

Deep dive: how each n8n node is configured

Webhook Trigger: catching GitHub commits

This is where everything starts. Configure it to:

  • Use method POST.
  • Use a clear path such as /github-commit-jenkins.

In GitHub, create a webhook under Settings → Webhooks, point it to your n8n webhook URL plus that path, and filter to push events or any additional events you want. Once that is done, every push politely knocks on your workflow’s door.

Text Splitter: breaking up long commit payloads

Some commits are short and sweet, others are “refactor entire app” essays. The Text Splitter keeps things manageable by using a character-based splitter. In the template, it uses:

{  "chunkSize": 400,  "chunkOverlap": 40
}

This keeps chunks small enough for embeddings while overlapping slightly so context is not lost. It improves the quality of semantic similarity queries later on.

Embeddings (OpenAI): turning text into vectors

The Embeddings node uses OpenAI’s text-embedding-3-small model. Attach your OpenAI credential to this node and it will:

  • Take each text chunk from the splitter.
  • Generate a vector embedding for it.
  • Send those vectors to Supabase for indexing.

Keep an eye on token usage and quotas, especially if your repo is very active. You can tweak chunk sizes or batch operations to stay within rate limits.

Supabase Insert and Query: your vector brain

In Supabase, create a vector index, for example named github_commit_jenkins. The workflow uses two key nodes:

  • Supabase Insert Stores:
    • Chunked documents.
    • Their embeddings.
    • Metadata like repo, commit hash, author, and timestamp.

    This metadata is gold later when you want to filter or audit.

  • Supabase Query Performs a similarity search to fetch the top relevant chunks for the RAG agent. You can tune parameters such as:
    • top_k (how many neighbors to fetch).
    • Distance metric, depending on your vector setup.

Vector Tool and Window Memory: giving the agent context

The Vector Tool is how the RAG agent talks to your Supabase vector store. When the agent needs context, it uses this tool to pull relevant chunks.

Window Memory keeps a short rolling history of recent interactions. That way, if several related commits come in a row or you trigger follow-up processing, the agent can “remember” what just happened instead of starting from scratch every time.

RAG Agent and Chat Model: the brains of the operation

The RAG Agent is the orchestration layer that:

  • Uses the Chat Model node (OpenAI Chat endpoints) as its language model.
  • Calls the Vector Tool to retrieve context from Supabase.
  • Uses Window Memory for short-term history.

It is configured with:

  • A system message that sets its role, for example: You are an assistant for GitHub Commit Jenkins.
  • A task prompt that explains how to process the incoming data, such as generating summaries, checking for security terms, or deciding whether to trigger Jenkins jobs.

Because it is RAG-based, the agent does not just hallucinate. It uses actual commit data pulled from your vector store to produce contextual, grounded output.

Append Sheet (Google Sheets): logging everything

To keep a nice audit trail that even non-engineers can read, the workflow uses the Append Sheet node. It writes the RAG Agent output into a Google Sheet with columns like:

  • Status
  • Commit
  • Author
  • Timestamp

The template appends results to a Log sheet, turning it into a simple reporting and review dashboard. Great for managers, auditors, or your future self trying to remember what happened last week.

Slack Alert: instant feedback when things go wrong

When the RAG agent detects errors or important statuses, it triggers the Slack Alert node. You can configure it to post in a channel like #alerts, including fields such as:

  • Error message
  • Commit hash
  • Repository name
  • Link to the corresponding row in Google Sheets

Instead of discovering failures hours later in a random log file, you get a clear “hey, fix me” message right in Slack.

Real-world ways to use this GitHub → Jenkins automation

Once this workflow is running, you can plug it into a bunch of practical scenarios:

  • Automatic release notes Summarize commit messages and push them to a release dashboard or hand them to Jenkins as part of your deployment pipeline.
  • Semantic security checks Scan commit messages for security-related keywords or patterns and automatically trigger Jenkins jobs or security scans when something suspicious appears.
  • Context-enriched CI pipelines Use vector search to pull in relevant historical commits so Jenkins jobs have more context about what changed and why.
  • Human-friendly reporting Send clear summaries to Google Sheets so non-technical stakeholders can follow along without needing to read diffs.

Security and best practices (so you can sleep at night)

Automation is fun until you accidentally expose secrets or log sensitive data. To keep things safe:

  • Use GitHub webhook secrets and validate payload signatures in n8n.
  • Store all API keys in n8n credentials, never hard-coded. Limit scope and rotate them regularly.
  • Lock down your n8n instance with IP allowlists or VPNs, especially in production.
  • Rate-limit embedding requests and cache repeated embeddings where possible to control costs.
  • Sanitize payloads before storing them in vector databases or logs so you do not accidentally index sensitive information.

Troubleshooting: when the robots misbehave

No webhook events are showing up

If your workflow is suspiciously quiet:

  • Double-check the webhook URL in GitHub.
  • Inspect GitHub webhook delivery logs for errors.
  • Confirm that your n8n endpoint is reachable. If you use ngrok, make sure the tunnel is running and that GitHub has the latest URL.

Embeddings are failing or super slow

When embedding performance tanks:

  • Verify your OpenAI API key and account quota.
  • Reduce chunk size or batch embeddings to avoid hitting rate limits.
  • Check n8n logs for request latency or error messages.

Supabase query returns random or irrelevant results

If the RAG agent seems confused:

  • Confirm you are using the intended embedding model.
  • Make sure your vector table is properly populated with representative data.
  • Tune similarity search settings like top_k and the distance metric.

Observability and monitoring: watch the pipeline, not just the logs

To keep this GitHub-to-Jenkins automation healthy, track a few key metrics:

  • Webhook delivery success and failure rates.
  • Embedding API errors and latency.
  • Supabase insert and query performance.
  • RAG agent execution times.
  • Slack alert frequency and error spikes.

You can use tools like Grafana or Prometheus for dashboards, or rely on n8n’s execution history plus your Google Sheets logs as a simple audit trail.

Wrapping up: from repetitive chores to smart automation

This n8n workflow template connects GitHub commits to an intelligent, RAG-powered process that works hand-in-hand with Jenkins, Supabase, and OpenAI. You get:

  • Automated handling of commit events.
  • Semantic understanding via embeddings and vector search.
  • Context-aware processing with a RAG agent.
  • Structured logging in Google Sheets.
  • Real-time Slack alerts when things go off script.

To get started, simply import the template, plug in your credentials, and test with a few sample commits. Then iterate on:

  • Prompt design for the RAG agent.
  • Chunking strategy in the Text Splitter.
  • Vector metadata design and Supabase query parameters.

As you refine it, the workflow becomes a tailored automation layer that fits your team’s CI/CD style perfectly.

Call to action: Import this n8n template, subscribe for more DevOps automation guides, or reach out if you want help adapting it to your environment. Ready to automate smarter and retire a few repetitive tasks from your daily routine?

GDPR Violation Alert: n8n + Vector DB Workflow

GDPR Violation Alert: n8n + Vector DB Workflow

This documentation-style guide describes a reusable, production-ready n8n workflow template that detects, enriches, and logs potential GDPR violations using vector embeddings, a Supabase vector store, and an LLM-based agent. It explains the architecture, node configuration, data flow, and operational considerations so you can confidently deploy and customize the automation in a real environment.

1. Workflow Overview

The workflow implements an automated GDPR violation alert pipeline that:

  • Accepts incoming incident reports or logs through an HTTP webhook
  • Splits long text into chunks suitable for embedding and retrieval
  • Generates embeddings with OpenAI and stores them in a Supabase vector database
  • Queries the vector store for similar historical incidents
  • Uses a HuggingFace-powered chat model and agent to classify and score potential GDPR violations
  • Logs structured results into Google Sheets for auditing and downstream processing

This template is designed for teams that already understand GDPR basics, NLP-based semantic search, and n8n concepts such as nodes, credentials, and workflow triggers.

2. Use Case & Compliance Context

2.1 Why automate GDPR violation detection

Organizations that process personal data must detect, assess, and document potential GDPR violations quickly. Manual review of logs, support tickets, and incident reports does not scale and can introduce delays or inconsistencies.

This workflow addresses that gap by:

  • Automatically flagging content that may include personal data or GDPR-relevant issues
  • Providing a consistent severity classification and recommended next steps
  • Maintaining an audit-ready log of processed incidents
  • Leveraging semantic search to detect nuanced violations, not just keyword matches

Natural language processing and vector search allow the system to recognize similar patterns across different phrasings, making it more robust than simple rule-based or regex-based detection.

3. High-Level Architecture

At a high level, the n8n workflow consists of the following components, ordered by execution flow:

  1. Webhook – Entry point that accepts POST requests with incident content.
  2. Text Splitter – Splits long input text into overlapping chunks.
  3. Embeddings (OpenAI) – Transforms text chunks into vectors.
  4. Insert (Supabase Vector Store) – Persists embeddings and metadata.
  5. Query + Tool – Performs similarity search and exposes it as an agent tool.
  6. Memory – Maintains recent context for multi-step reasoning.
  7. Chat (HuggingFace) – LLM that performs reasoning and classification.
  8. Agent – Orchestrates tools and model outputs into a structured decision.
  9. Google Sheets – Appends a log row for each processed incident.

The combination of webhook ingestion, vector storage, and an LLM-based agent makes this workflow suitable as a central component in a broader security or privacy incident management pipeline.

4. Node-by-Node Breakdown

4.1 Webhook Node – Entry Point

Purpose: Accepts incoming GDPR-related reports, alerts, or logs via HTTP POST.

  • HTTP Method: POST
  • Path: /webhook/gdpr_violation_alert

Typical payload sources:

  • Support tickets describing data exposure or access issues
  • Security Information and Event Management (SIEM) alerts that may contain user identifiers
  • Automated privacy scanners or third-party monitoring tools

Configuration notes:

  • Enable authentication or IP allowlists to restrict who can call the endpoint.
  • Validate JSON structure early to avoid downstream errors in text processing nodes.
  • Normalize incoming fields (for example, map description, message, or log fields into a single text field used by the Splitter).

4.2 Text Splitter Node – Chunking Input Text

Purpose: Breaks long incident descriptions or logs into smaller segments that fit embedding and context constraints.

  • Chunk size: 400 characters (or tokens, depending on implementation)
  • Chunk overlap: 40 characters

Behavior:

  • Ensures that each chunk retains enough local context for meaningful embeddings.
  • Overlap avoids losing critical context at chunk boundaries, improving search quality.
  • Protects against exceeding embedding model token limits on very long inputs.

Edge considerations:

  • Short texts may result in a single chunk, which is expected and supported.
  • Very large logs will produce many chunks, which may impact embedding cost and query time.

4.3 Embeddings Node (OpenAI) – Vectorization

Purpose: Converts each chunk into a high-dimensional vector representation for semantic search.

  • Provider: OpenAI Embeddings
  • Model: A semantic search capable embedding model (workflow uses the default embedding model configured in n8n)

Data stored per chunk:

  • Text chunk content
  • Vector embedding
  • Metadata such as:
    • Source or incident ID
    • Timestamp of the report
    • Chunk index or position
    • Optional severity hints or category tags

Configuration considerations:

  • Use a model optimized for semantic similarity tasks, not for completion.
  • Propagate metadata fields from the webhook payload so that search results remain explainable.
  • Handle API errors or rate limits by configuring retries or backoff at the n8n workflow level.

4.4 Insert Node – Supabase Vector Store

Purpose: Writes embeddings and associated metadata into a Supabase-backed vector index.

  • Index name: gdpr_violation_alert
  • Operation mode: insert (adds new documents and vectors)

Functionality:

  • Persists each chunk embedding into the configured index.
  • Enables efficient nearest-neighbor queries across historical incidents.
  • Supports use cases such as:
    • Identifying repeated PII exposure patterns
    • Finding similar previously investigated incidents
    • Detecting known risky phrases or behaviors

Configuration notes:

  • Ensure Supabase credentials are correctly set up in n8n.
  • Map metadata fields consistently so that future queries can filter or explain results.
  • Plan for index growth and retention policies as the volume of stored incidents increases.

4.5 Query Node + Tool Node – Vector Search as an Agent Tool

Purpose: Retrieve similar incidents from the vector store and expose that capability to the agent.

Query Node:

  • Executes a similarity search against gdpr_violation_alert using the current input embedding or text.
  • Returns the most similar stored chunks, along with their metadata.

Tool Node:

  • Wraps the Query node as a tool that the agent can call on demand.
  • Enables the agent to perform hybrid reasoning, for example:
    • “Find previous incidents mentioning ’email dump’ similar to this report.”
  • Provides the agent with concrete historical context to improve its classification and recommendations.

Edge considerations:

  • If the index is empty or few matches exist, the query may return no or low-quality results. The agent should be prompted to handle this gracefully.
  • Similarity thresholds can be tuned within the node configuration or in downstream logic to reduce noisy matches.

4.6 Memory Node & Chat Node (HuggingFace) – Context and Reasoning

Memory Node:

  • Type: Buffer-window memory
  • Purpose: Stores recent conversation or processing context for the agent.
  • Maintains a sliding window of messages so the agent can reference prior steps and tool outputs without exceeding model context limits.

Chat Node (HuggingFace):

  • Provider: HuggingFace
  • Role: Core language model that interprets the incident, vector search results, and prompt instructions.
  • Performs:
    • Summarization of incident content
    • Classification of GDPR relevance
    • Reasoning about severity and recommended actions

Combined behavior:

  • The memory node ensures the agent can reason across multiple tool calls and intermediate steps.
  • The chat model uses both the original text and vector search context to produce informed decisions.

4.7 Agent Node – Decision Logic and Orchestration

Purpose: Orchestrates the chat model and tools, then outputs a structured decision object.

Core responsibilities:

  • Call the Chat node and Tool node as needed.
  • Apply prompt instructions that define what constitutes a GDPR violation.
  • Generate structured fields for downstream logging.

Recommended prompt behavior:

  • Determine whether the text:
    • Contains personal data (names, email addresses, phone numbers, identifiers)
    • Indicates a possible GDPR breach or is more likely a benign report
  • Assign a severity level such as:
    • Low
    • Medium
    • High
  • Recommend next actions, for example:
    • Escalate to Data Protection Officer (DPO)
    • Redact or anonymize specific data
    • Notify affected users or internal stakeholders
  • Produce structured output fields:
    • Timestamp
    • Severity
    • Short summary
    • Evidence snippets or references to chunks

Prompt example:

"Classify whether the given text contains personal data (names, email, phone, identifiers), indicate the likely GDPR article impacted, and assign a severity level with reasoning."

Error-handling considerations:

  • Ensure the agent prompt instructs the model to output a consistent JSON-like structure to avoid parsing issues.
  • Handle model timeouts or failures in n8n by configuring retries or fallback behavior if needed.

4.8 Google Sheets Node – Logging & Audit Trail

Purpose: Persist the agent’s decision and metadata in a human-readable, queryable format.

  • Operation: Append
  • Target: Sheet named Log

Typical logged fields:

  • Incident timestamp
  • Severity level
  • Short description or summary
  • Key evidence snippets or references
  • Optional link to original system or ticket ID

Usage:

  • Serves as an audit trail for compliance and internal reviews.
  • Can be integrated with reporting dashboards or ticketing systems.
  • Allows manual overrides or annotations by privacy and security teams.

5. Implementation & Configuration Best Practices

5.1 Webhook Security

Do not expose the webhook endpoint publicly without controls. Recommended measures:

  • Require an API key header or bearer token in incoming requests.
  • Implement HMAC signature validation so only trusted systems can send data.
  • Use IP allowlists or VPN access restrictions where possible.
  • Rate limit the endpoint to mitigate abuse and accidental floods.

5.2 Metadata & Observability

Rich metadata improves search quality and incident analysis. When inserting embeddings, include fields such as:

  • Origin system (for example, support desk, SIEM, scanner)
  • Submitter or reporter ID (hashed or pseudonymized if sensitive)
  • Original timestamp and timezone
  • Chunk index and total chunks count
  • Any initial severity hints or category labels from the source system

These fields help with:

  • Explaining why a particular incident was flagged
  • Tracing issues across systems during root-cause analysis
  • Filtering historical incidents by source or timeframe

5.3 Prompt Design for the Agent

Clear, explicit prompts are critical for consistent classification. When defining the agent prompt:

  • Specify what qualifies as personal data, with examples.
  • Instruct the model to refer to GDPR concepts (for example, personal data, data breach, processing, consent) without making legal conclusions.
  • Define severity levels and criteria for each level.
  • Request a deterministic, structured output format that can be parsed by n8n.

Use the earlier example prompt as a baseline, then iterate based on false positives and negatives observed during testing.

5.4 Data Minimization & Privacy Controls

GDPR requires limiting stored personal data to what is strictly necessary. Within this workflow:

  • Consider hashing or redacting highly sensitive identifiers (for example, full email addresses, phone numbers) before sending them to embedding or logging nodes.
  • If raw content is required for investigations:
    • Restrict access to the vector store and Google Sheets to authorized roles only.
    • Define retention periods and automatic deletion processes.
  • Avoid storing more context than necessary in memory or logs.

5.5 Monitoring & Alerting Integration

For high-severity events, integrate the workflow with alerting tools:

  • Send notifications to Slack channels for immediate team visibility.
  • Trigger PagerDuty or similar incident response tools for critical cases.
  • Use n8n branches or additional nodes to:
    • Throttle repeated alerts from the same source
    • Implement anomaly detection and rate-based rules to reduce noise

6. Testing & Validation Strategy

Before deploying this workflow to production, perform structured testing:

  • Synthetic incidents: Create artificial examples that clearly contain personal data and obvious violations.
  • Historical incidents: Replay anonymized or sanitized real cases to validate behavior.
  • Borderline cases: Include:
    • Pseudonymized or tokenized data
    • Aggregated statistics without individual identifiers
    • Internal technical logs that may or may not contain user data

Automating Game Bug Triage with n8n and Vector Embeddings

Automating Game Bug Triage with n8n and Vector Embeddings

Keeping up with bug reports in a live game can feel like playing whack-a-mole, right? One report comes in, then ten more, and suddenly you’re juggling duplicates, missing critical issues, and copying things into spreadsheets at 11 pm.

This is where an automated bug triage workflow in n8n really shines. In this guide, we’ll walk through a ready-to-use n8n template that uses:

  • Webhooks to ingest bug reports
  • Text splitting for long descriptions
  • Cohere embeddings to turn text into vectors
  • A Redis vector store for semantic search
  • An LLM-backed agent to analyze and prioritize bugs
  • Google Sheets for simple, shareable logging

The result: a scalable bug triage pipeline that automatically ingests reports, indexes them semantically, retrieves relevant context, and logs everything in a structured way. Less manual triage, more time to actually fix the game.

Why bother automating game bug triage?

If you’ve ever handled bug reports manually, you already know the pain points:

  • It’s slow – reports pile up faster than you can read them.
  • Duplicates slip through – same bug, different wording, new ticket.
  • Important issues get buried – P0 bugs arrive, but they look like just another report.
  • Context gets lost – logs, player info, and environment details end up scattered.

This n8n workflow template tackles those problems by:

  • Capturing bug reports instantly through a Webhook
  • Splitting long descriptions into searchable chunks
  • Storing semantic embeddings in Redis for robust similarity search
  • Using an Agent + LLM to summarize, prioritize, and label bugs
  • Logging everything into Google Sheets so your team has a simple, central source of truth

In short, it helps you find duplicates faster, spot critical issues sooner, and keep a clean log without babysitting every report.

What this n8n workflow template actually does

Let’s look at the high-level architecture first, then we’ll go step by step.

Key components in the workflow

The reference n8n workflow uses the following nodes:

  • Webhook – receives bug reports via HTTP POST
  • Splitter – breaks long text into smaller chunks (chunkSize 400, overlap 40)
  • Embeddings (Cohere) – converts text chunks into vector embeddings
  • Insert (Redis vector store) – indexes embeddings in Redis with indexName=game_bug_triage
  • Query (Redis) – searches the vector index for similar past reports
  • Tool (VectorStore wrapper) – exposes those search results as a tool for the agent
  • Memory (buffer window) – keeps recent interactions for context
  • Chat (language model, Hugging Face) – provides the LLM processing power
  • Agent – coordinates tools, memory, and the LLM, then formats a structured triage output
  • Sheet (Google Sheets) – appends a row to your triage log sheet

Now let’s unpack how all of this works together when a new bug report comes in.

Step-by-step: How the bug triage workflow runs

1. Bug reports flow in through a Webhook

First, your game or community tools send bug reports directly into n8n using a Webhook node.

This could be wired up from:

  • An in-game feedback form
  • A Discord bot collecting bug reports
  • A customer support or web form

These systems POST a JSON payload to the webhook URL. A typical payload might include:

  • title
  • description
  • playerId
  • platform (PC, console, mobile)
  • buildNumber
  • Links to screenshots or attachments (files themselves are usually stored elsewhere)

The Webhook node ensures reports are captured in real time, so you don’t have to import or sync anything manually.

2. Clean up and split long descriptions

Bug reports can be messy. Some are short, others are walls of logs and text. To make them usable for embeddings and semantic search, the workflow uses a Splitter node.

In the template, the Splitter is configured with:

  • chunkSize: 400 characters
  • chunkOverlap: 40 characters

Why those numbers?

  • 400 characters is a nice balance between context and precision. It’s big enough to keep related information together, but not so large that embeddings become noisy or expensive.
  • 40 characters overlap ensures that context flows from one chunk to the next. That way, semantic search still “understands” the bug even when it spans multiple chunks.

The result: long descriptions and logs are broken into chunks that are easier to index and search, without losing the bigger picture.

3. Turn text into embeddings with Cohere

Once the text is split, each chunk is passed to the Cohere Embeddings node.

Embeddings are dense numeric vectors that capture the meaning of text. Instead of matching exact keywords, you can search by semantic similarity. For example, these can help you find:

  • Two reports describing the same crash but in totally different words
  • Different players hitting the same UI bug on different platforms

Cohere’s embeddings model converts each chunk into a vector that can be stored and searched efficiently.

4. Index all bug chunks in a Redis vector store

Those embeddings need a home, and that’s where Redis comes in.

The workflow uses an Insert node that writes embeddings into a Redis vector index named game_bug_triage. Along with each vector, you can store metadata, such as:

  • playerId
  • buildNumber
  • platform
  • timestamp
  • Attachment or screenshot URLs

Redis is fast and production-ready, which makes it a solid choice for high-throughput bug triage in a live game environment.

5. Query Redis for related bug reports

When a new bug comes in and you want to triage it, the workflow uses a Query node to search the same Redis index.

This node performs a similarity search over the game_bug_triage index and returns the most relevant chunks. That retrieved context helps you (or rather, the agent) answer questions like:

  • Is this bug a duplicate of something we’ve already seen?
  • Has this issue been reported in previous builds?
  • Does this look like a known crash, UI glitch, or network problem?

The results are wrapped in a Tool node (a VectorStore wrapper) so the agent can call this “search tool” as part of its reasoning process.

6. Agent, Memory, and LLM work together to triage

This is where the magic happens. The Agent node coordinates the logic using:

  • The raw bug payload from the Webhook
  • Relevant context from Redis via the Tool
  • Recent interaction history from the Memory node (buffer window)
  • The Chat node, which connects to a Hugging Face language model

The agent then produces a structured triage result. Typically, that includes fields like:

  • Priority (P0 – P3)
  • Likely cause (Networking, Rendering, UI, etc.)
  • Duplicate of (if it matches a known issue)
  • Suggested next steps for the team

In the provided workflow, the Agent uses a prompt with promptType="define" and the text set to = {{$json}}. You’ll want to fine-tune this prompt with clear instructions and examples so the model consistently returns the fields you care about.

7. Log everything into Google Sheets

Finally, the structured triage result is appended to a Google Sheet using the Sheet node.

In the template, the sheet name is set to “Log”. Each new bug triage becomes a new row with all the important details.

Why Google Sheets?

  • Everyone on the team can view it without extra tooling.
  • You can plug it into dashboards or BI tools later.
  • It works as an audit trail for how bugs were classified over time.

From there, you can build further automations, like syncing into JIRA, GitHub, or your internal tools.

How to get the most out of this template

Prompt engineering for reliable outputs

The Agent is only as good as the instructions you give it. To make your triage results consistent:

  • Define required fields clearly, such as priority, category, duplicateOf, nextSteps.
  • Specify allowed values for priority and severity (for example P0 to P3, or Critical / High / Medium / Low).
  • Provide example mappings, like “frequent disconnects during matchmaking” → Networking, or “UI elements not clickable” → UI.
  • Include a few sample bug reports and the expected structured output in the prompt.

The better your examples, the more predictable your triage results will be.

Fine-tuning chunking and embeddings

Chunking is not one-size-fits-all. You can experiment with:

  • chunkSize – larger chunks capture more context but cost more to embed and may be less precise.
  • chunkOverlap – more overlap keeps context smoother but increases total embedding volume.

Start with the default 400 / 40 settings, then:

  • Check whether similar bugs are being matched correctly.
  • Adjust chunk size if your reports are usually much shorter or much longer.

Designing useful metadata

Metadata is your friend when you want to filter or slice your search results. Good candidates for metadata in the Redis index include:

  • buildNumber
  • platform (PC, PS, Xbox, Mobile, etc.)
  • region
  • Attachment or replay URLs

With this, you can filter by platform or build, for example “show similar bugs, but only on the current production build.”

Scaling and performance tips

As your game grows, so will your bug reports. To keep the system snappy:

  • Use a production-ready Redis deployment or managed service like Redis Cloud.
  • Batch embedding requests where possible to reduce API overhead.
  • Monitor the size of your Redis index and periodically:
    • Prune very old entries, or
    • Archive them to cheaper storage if you still want history.

Security and privacy considerations

Game logs and bug reports can contain sensitive data, so it’s important to handle them carefully:

  • Sanitize or remove any personally identifiable information (PII) before indexing.
  • If logs contain user tokens, IPs, or emails, redact or hash them.
  • Secure your Webhook endpoint with:
    • HMAC signatures
    • API keys or other authentication
  • Restrict access to your Redis instance and Google Sheets credentials.

Testing and monitoring your triage pipeline

Before you roll this out to your entire player base, it’s worth doing a bit of tuning.

  • Start with a test dataset of real historical bug reports.
  • Use those to refine:
    • Your chunking settings
    • Your prompts and output schema
  • Track key metrics, such as:
    • Triage latency – how long it takes from report to logged result.
    • Accuracy – how often duplicates are correctly identified.
    • False positives – when unrelated bugs are marked as duplicates.
  • Regularly sample model-generated outputs for human review and iterate on prompts.

A bit of upfront testing pays off quickly once the system is running on live data.

Popular extensions to this workflow

Once you have the core triage automation running, it’s easy to extend it in n8n. Some common next steps include:

  • Auto-create tickets in JIRA or GitHub when a bug hits a certain priority (for example P0 or P1).
  • Send alerts to Slack or Discord channels for high-priority issues, including context and a link to the Google Sheet.
  • Attach related assets like screenshots or session replays, using URLs stored as metadata in the vector index.
  • Build dashboards to visualize trends over time, like bug volume by build or platform.

Because this is all in n8n, you can keep iterating without rebuilding everything from scratch.

Putting it all together

This n8n Game Bug Triage template gives you a practical, AI-assisted pipeline that:

  • Ingests bug reports automatically
  • Indexes them using semantic embeddings in Redis
  • Uses an LLM-driven agent to prioritize and categorize issues
  • Logs everything into a simple, shareable Google Sheet

It reduces manual triage work, surfaces critical issues faster, and gives your team a solid foundation to build more automation on top of.

Ready to try it?

Here’s a simple way to get started:

  1. Import the n8n workflow template.
  2. Plug in your Cohere and Redis credentials.
  3. Point your game’s bug reporting system at the Webhook URL.
  4. Test with a set of sample bug reports and tweak

Automate Blog Comments to Discord with n8n

Automate Blog Comments to Discord with n8n

Picture this: you publish a new blog post, go grab a coffee, and by the time you are back there are fifteen new comments. Some are brilliant, some are spicy, and some are just “first!”. Now imagine manually reading, summarizing, logging, and sharing the best ones with your Discord community every single day. Forever.

If that sounds like a recurring side quest you did not sign up for, this is where n8n comes in to save your sanity. In this guide, we will walk through an n8n workflow template that automatically turns blog comments into searchable context, runs them through a RAG (retrieval-augmented generation) agent, stores everything neatly in Supabase, logs outputs to Google Sheets, and optionally sends the interesting stuff to Discord (or Slack) so your team and community never miss a thing.

All the brain work stays, the repetitive clicking goes away.

What this n8n workflow actually does

This template is built to solve three very real problems that show up once your blog grows beyond “my mom and two friends” traffic:

  • Capture everything automatically – Every comment is ingested, split, embedded, and stored in a Supabase vector store so you can search and reuse it later.
  • Use RAG to respond intelligently – A RAG agent uses embeddings and historical context to create summaries, suggested replies, or moderation hints that are actually relevant.
  • Send the important bits where people live – Highlights and action items can be sent to Discord or Slack, while all outputs are logged to Google Sheets for tracking and audit.

In other words, you get a tireless assistant that reads every comment, remembers them, and helps you respond in a smart way, without you living inside your CMS all day.

Under the hood: key n8n building blocks

Here is the cast of characters in this automation, all wired together inside n8n:

  • Webhook Trigger – Receives incoming blog comment payloads via HTTP POST.
  • Text Splitter – Chops long comments into smaller, embedding-friendly chunks.
  • Embeddings (Cohere) – Uses the embed-english-v3.0 model to turn text chunks into vectors.
  • Supabase Insert / Query – Stores vectors and metadata, and later retrieves similar comments for context.
  • Vector Tool – Packages retrieved vectors so the RAG agent can easily access contextual information.
  • Window Memory – Keeps recent conversation context available for the agent.
  • Chat Model (Anthropic) – Generates summaries, replies, or moderation recommendations.
  • RAG Agent – Orchestrates the retrieval + generation steps and sends final output to Google Sheets.
  • Slack Alert – Sends a message if any node errors out so failures do not silently pile up.

Optionally, you can add a Discord node or HTTP Request node to post approved highlights straight into a Discord channel via webhook.

How the workflow runs, step by step

Let us walk through what actually happens when a new comment shows up, from “someone typed words” to “Discord and Google Sheets are updated.”

1. Receive the comment via webhook

The workflow starts with a Webhook Trigger node. This exposes an HTTP POST endpoint in n8n. Your blog or CMS should be configured to send comment data to this endpoint whenever a new comment is created.

Example payload:

{  "post_id": "123",  "comment_id": "c456",  "author": "Jane Doe",  "content": "Thanks for the article! I think the performance section could use benchmarks.",  "timestamp": "2025-08-31T12:34:56Z"
}

So instead of you refreshing the comments page on loop, your blog just pings n8n directly.

2. Split and embed the text

Next, the comment text goes to a Text Splitter node. This is where long comments get sliced into smaller chunks so the embedding model can handle them efficiently.

In the template, the recommended settings are:

  • Chunk size – 400 characters
  • Overlap – 40 characters

This keeps enough overlap to preserve context between chunks without exploding your storage or embedding costs.

Each chunk is then passed to Cohere’s embed-english-v3.0 model. The node generates a vector for each chunk, which is essentially a numerical representation of the meaning of that text. These vectors are what make similarity search and RAG magic possible later on.

3. Store embeddings in Supabase

Once you have vectors, the workflow uses a Supabase Insert node to store them in a Supabase table or index, for example blog_comment_discord.

Along with each vector, the following metadata is stored:

  • post_id
  • comment_id
  • author or anonymized ID
  • timestamp

This metadata makes it possible to filter, search, and trace comments later, which is extremely helpful when you need to answer questions like “what were people saying on this post last month?” or “which comment did this summary come from?”

4. Retrieve context for RAG

When the workflow needs to generate a response, summary, or moderation suggestion, it uses a Supabase Query node to look up similar vectors. This retrieves the most relevant historical comments based on semantic similarity.

The results are then wrapped by a Vector Tool node. This gives the RAG agent a clean interface to fetch contextual snippets and ground its responses in real past comments, instead of hallucinating or guessing.

5. RAG agent and Chat Model (Anthropic)

Now the fun part. The RAG Agent pulls together:

  • The current comment
  • The retrieved context from Supabase via the Vector Tool
  • A system prompt that tells it what kind of output to produce

It then calls a Chat Model node using Anthropic. The model generates the final output, which could be:

  • A short summary of the comment
  • A suggested reply for you or your team
  • A moderation recommendation or policy-based decision

You can customize the agent prompt to match your tone and use case. For example, here is a solid starting point:

System: You are an assistant that summarizes blog comments. Use retrieved context only to ground your answers. Produce a 1-2 sentence summary and a recommended short reply for the author.

Change the instructions to be more friendly, strict, or concise depending on your community style.

6. Log to Google Sheets and notify your team

Once the RAG agent has done its job, the workflow sends the final output to a Google Sheets Append node. This writes a new row in a “Log” sheet so you have a complete history of processed comments and generated responses.

Meanwhile, if anything fails along the way (API hiccups, schema issues, etc.), the onError path triggers a Slack Alert node that posts into a channel such as #alerts. That way you find out quickly when automation is unhappy instead of discovering missing data a week later.

On top of that, you can plug in a Discord node or HTTP Request node to post selected summaries, highlights, or suggested replies straight into a Discord channel via webhook. This is great for surfacing the best comments to your community or to a private moderation channel for review.

Posting to Discord: quick example

To send a summary to Discord after human review or automatic approval, add either:

  • A Discord node configured with your webhook URL, or
  • An HTTP Request node pointing at the Discord webhook URL

A minimal JSON payload for a Discord webhook looks like this:

{  "content": "New highlighted comment on Post 123: \"Great article - consider adding benchmarks.\" - Suggested reply: Thanks! We'll add benchmarks in an update." 
}

You can dynamically fill in the post ID, comment text, and suggested reply from previous nodes so Discord always gets fresh, contextual messages.

Configuration tips and best practices

Once you have the template running, a bit of tuning goes a long way to make it feel tailored to your blog and community.

Chunking strategy

The default chunk size of 400 characters with a 40-character overlap works well for many setups, but you can tweak it based on typical comment length:

  • Short comments – You can reduce chunk size or even skip aggressive splitting.
  • Long, essay-style comments – Keep overlap to preserve context across chunks, but be mindful that more overlap means more storage and more embeddings.

Choosing an embedding model

The template uses Cohere’s embed-english-v3.0 model, which is a strong general-purpose option for English text. If your comments are in a specific domain or language, you might consider another model that better fits your content.

Keep an eye on:

  • Cost – More comments and more chunks mean more embeddings.
  • Latency – If you want near real-time responses, model speed matters.

Metadata and indexing strategy

Good metadata makes your life easier later. When storing vectors in Supabase, make sure you include:

  • post_id to group comments by article
  • comment_id to uniquely identify each comment
  • author or an anonymized identifier
  • timestamp for chronological analysis

It is also smart to namespace your vector index per environment or project, for example:

  • blog_comment_discord_dev
  • blog_comment_discord_prod

This avoids collisions when you are testing changes and keeps production data nice and clean.

RAG prompt engineering

The system prompt you give the RAG agent has a huge impact on the quality and tone of its output. Use clear instructions and be explicit about length, style, and constraints.

For example:

System: You are an assistant that summarizes blog comments. Use retrieved context only to ground your answers. Produce a 1-2 sentence summary and a recommended short reply for the author.

From here, you can iterate. Want more playful replies, stricter moderation, or bullet-point summaries? Update the prompt and test with a few sample comments until it feels right.

Security essentials

Automation is great, leaking API keys is not. A few simple habits keep this workflow safe:

  • Store all API keys (Cohere, Supabase, Anthropic, Google Sheets, Discord, Slack) as n8n credentials or environment variables, not hardcoded in JSON or shared repos.
  • If your webhook is publicly accessible, validate payloads. Use signatures or a shared secret to prevent spam or malicious requests from triggering your workflow.

Monitoring and durability

To keep things reliable over time:

  • Use the onError path and Slack Alert node so your team is notified whenever something breaks.
  • Implement retries for transient issues like network timeouts or temporary API failures.
  • Track processed comment_id values in your datastore so that if a webhook is retried, you do not accidentally process the same comment multiple times.

That way, your automation behaves more like a dependable teammate and less like a moody script.

Ideas to extend the workflow

Once the basics are in place, you can start layering on extra capabilities without rewriting everything from scratch.

  • Moderation queue in Discord – Auto-post suggested replies into a private Discord channel where moderators can approve or tweak them before they go public.
  • Sentiment analysis – Tag comments as positive, neutral, or negative and route them to different channels or sheets for follow-up.
  • Daily digests – Aggregate summaries of comments and send a daily recap to your team or community.
  • Role-based workflows – Use different n8n credentials or logic paths so some users can trigger automated posting, while others can only view suggestions.

Think of the current template as a foundation. You can stack features on top as your needs evolve.

Testing checklist before going live

Before you trust this workflow with your real community, run through this quick checklist:

  • Send a test POST to the webhook with a realistic comment payload.
  • Check that the Text Splitter chunks the comment in a way that still preserves meaning.
  • Verify that embeddings are generated and stored in Supabase with the correct metadata.
  • Run a full flow and confirm the RAG output looks reasonable, and that it is logged to Google Sheets correctly.
  • Trigger a deliberate error (for example, by breaking a credential in a test environment) and confirm the Slack notification fires.

Once all of that checks out, you are ready to let automation handle the boring parts while you focus on writing more great content.

Conclusion: let automation babysit your comments

This n8n-based RAG workflow gives you a scalable way to handle blog comments without living in your moderation panel. With Supabase storing vectorized context, Cohere generating embeddings, Anthropic handling generation, and Google Sheets logging everything, you end up with a robust system that:

  • Makes comments searchable and reusable
  • Produces context-aware summaries and replies
  • Surfaces highlights to Discord or Slack automatically

Instead of manually copy-pasting comments into spreadsheets and chat apps, you get a smooth pipeline that runs in the background.

Next steps: import the template into n8n, plug in your credentials (Cohere, Supabase, Anthropic, Google Sheets, Slack/Discord), and run a few test comments. Tweak chunk sizes, prompts, and notification rules until the workflow feels like a helpful assistant instead of a noisy robot.

Call to action: Try the n8n template today, throw a handful of real comments at it, and start piping the best ones into your Discord channel. If you want a tailored setup or need help adapting it to your stack, reach out for a customization walkthrough.

Automate GA Report Emails with n8n & RAG Agent

Automate GA Report Emails with n8n & a RAG Agent

Imagine never having to skim through another massive Google Analytics report just to figure out what actually matters. With this n8n workflow template, you can do exactly that.

This reusable automation takes your GA report data, turns it into embeddings, stores it in Pinecone for smart search, and then uses an OpenAI-powered RAG (Retrieval-Augmented Generation) agent to write clear, human-friendly summaries. It can even log outputs to Google Sheets and alert you in Slack if something breaks.

In this guide, we’ll walk through what the workflow does, how the pieces fit together, when to use it, and how to set it up step by step in n8n.

What this n8n GA report email template actually does

At a high level, this workflow takes incoming GA reports, breaks them into chunks, converts them into embeddings, stores those embeddings in Pinecone, and then uses a RAG agent to generate an email-style summary with insights, anomalies, and recommended actions.

Here is what’s included in the template:

  • Webhook Trigger (path: ga-report-email) to receive GA report payloads from an external system.
  • Text Splitter (character-based) that splits long reports into chunks with:
    • chunkSize = 400
    • chunkOverlap = 40
  • Embeddings node using OpenAI:
    • Model: text-embedding-3-small
  • Pinecone Insert that stores embeddings in a Pinecone index named ga_report_email.
  • Pinecone Query + Vector Tool to retrieve the most relevant context for each new request.
  • Window Memory to keep short-term context for the RAG agent.
  • Chat Model & RAG Agent (OpenAI) that uses the retrieved context and current report to generate a summary or email body.
  • Append Sheet (Google Sheets) to log the output in a sheet called Log:
    • Status column maps to {{$json["RAG Agent"].text}}
  • Slack Alert that sends an error notification to a channel such as #alerts if something fails.

In other words, the template handles the boring parts: ingestion, storage, retrieval, and summarization, so you can focus on the insights.

Why use n8n, embeddings, and a RAG agent for GA reports?

Standard report automation can feel pretty rigid. You often end up with:

  • Fixed email templates that do not adapt to what actually happened in the data.
  • Fragile parsing scripts that break when the format changes.
  • No real context from historical reports.

By combining n8n, embeddings, and a RAG agent, you get something much smarter:

  • Reports are semantically indexed, not just stored as plain text.
  • The workflow can search historical context in Pinecone when generating new summaries.
  • The RAG agent can produce tailored, concise email summaries that highlight what changed, where anomalies are, and what to do next.

This is especially handy if you send recurring GA reports that need interpretation instead of just raw numbers. Think weekly performance summaries, monthly stakeholder updates, or anomaly alerts.

How the data flows through the workflow

Let’s quickly walk through what happens from the moment a GA report hits the webhook to the moment you get a summary.

  1. An external system (for example, a script or another tool) sends a GA report payload to /webhook/ga-report-email.
  2. The Text Splitter breaks the report into overlapping text chunks so the embeddings preserve context.
  3. The Embeddings node generates vector embeddings for each chunk and inserts them into the Pinecone index ga_report_email for long-term semantic search.
  4. When a new summary is needed, the workflow queries Pinecone for the most relevant stored context related to the incoming payload.
  5. The RAG Agent uses:
    • The retrieved context from Pinecone
    • The short-term memory from the Window Memory node
    • The current GA report payload

    to generate a summary, suggested actions, or a nicely formatted email body.

  6. The generated output is logged to Google Sheets for auditing, and if something goes wrong, a Slack alert gets triggered.

So instead of manually reading and interpreting every report, you get a clean, AI-assisted summary that still respects your historical data.

Before you start: credentials checklist

To get this template running smoothly in n8n, you’ll want to prepare the following credentials first.

1. OpenAI

  • Create an OpenAI API key.
  • Add it to n8n credentials as OPENAI_API.

2. Pinecone

  • Sign up for Pinecone and create an index called ga_report_email.
  • Add your Pinecone API credentials to n8n as PINECONE_API.

3. Google Sheets

  • Set up Google Sheets OAuth credentials.
  • Add them to n8n as SHEETS_API.
  • Create a spreadsheet with a sheet named Log to store the outputs.

4. Slack

  • Configure Slack API credentials in n8n as SLACK_API.
  • Choose an alert channel, for example #alerts, for error notifications.

Step-by-step: deploying the workflow in n8n

Step 1: Import and review the template

Start by importing the provided workflow JSON into your n8n instance. Once imported:

  • Confirm the Webhook Trigger path is set to ga-report-email.
  • Open the Text Splitter node and verify:
    • chunkSize = 400
    • chunkOverlap = 40
  • Check the Embeddings node:
    • Model is text-embedding-3-small
    • It uses your OPENAI_API credential.

Step 2: Confirm or create your Pinecone index

Make sure your Pinecone index ga_report_email exists and matches the embedding model’s dimension. If it is missing or misconfigured, create or adjust it via the Pinecone console or API so it aligns with text-embedding-3-small.

Step 3: Configure the RAG Agent and prompt

Next, open the RAG Agent node and set up the system message. A good starting point is:

“You are an assistant for GA Report Email. Summarize key metrics, anomalies, and recommended actions in 4-6 bullet points.”

You can tweak the temperature if you want more creative or more deterministic phrasing. Lower temperature gives you more consistent, predictable summaries.

Step 4: Verify Google Sheets and Slack nodes

  • In the Append Sheet node:
    • Set documentId to your spreadsheet ID.
    • Ensure sheetName is Log.
    • Confirm the mapping for the Status column is:
      {  "Status": "={{$json[\"RAG Agent\"].text}}"
      }
  • In the Slack node:
    • Use your SLACK_API credential.
    • Set the channel, such as #alerts.
    • Connect this node to the RAG Agent’s onError path.

Sample Google Sheets mapping

Here is the mapping used in the template for the Append Sheet node, so you can double-check your configuration:

{  "Append Sheet" : {  "operation": "append",  "documentId": "SHEET_ID",  "sheetName": "Log",  "columns": {  "mappingMode": "defineBelow",  "value": { "Status": "={{$json[\"RAG Agent\"].text}}" }  }  }
}

Ways to customize the workflow for your use case

Once you have the base template running, you can start tailoring it to your team’s needs. Here are a few practical ideas.

  • Send emails directly
    Add an SMTP or Gmail node after the RAG Agent to send the generated summary as an email to your stakeholders.
  • Tag metrics for richer retrieval
    Pre-parse the GA payload to extract key metrics like sessions, bounce rate, or conversions, and store them as metadata alongside your embeddings.
  • Schedule recurring reports
    Use a Cron node so you are not relying only on incoming webhooks. You can trigger daily or weekly runs that pull data directly from the GA API and then feed it into this workflow.
  • Support multiple languages
    Add translation nodes or adjust the RAG agent prompt to generate summaries in different languages depending on the recipient.

Security, privacy, and compliance considerations

Since you might be dealing with sensitive analytics data, it is worth tightening up your security practices.

  • Handle PII carefully
    Remove or mask any personally identifiable information before sending content to OpenAI or storing it in Pinecone.
  • Use least-privilege access
    Scope your API keys so they only have the permissions they truly need. Where possible, restrict IPs and keep write-only keys limited.
  • Encrypt and secure your stack
    Make sure Pinecone and any storage you use have encryption at rest enabled. Protect your n8n instance with HTTPS, a firewall, and secure secrets storage.
  • Define a retention policy
    If compliance requires it, regularly prune or delete old embeddings and logs from Pinecone and Google Sheets.

Costs and performance: what to watch

Most of your costs will come from:

  • Embedding generation
  • LLM (OpenAI Chat/Completion) calls

To keep things efficient and responsive:

  • Use a cost-effective embedding model like text-embedding-3-small.
  • Tune chunkSize and chunkOverlap so you have enough context without exploding the number of embeddings.
  • Limit Pinecone reads by retrieving a reasonable top-k instead of pulling large result sets.
  • Consider caching results for frequently repeated queries.

Troubleshooting common issues

If something is not working the way you expect, here are some quick checks that usually help.

  • Webhook not firing
    Make sure the webhook is active in n8n, that you are using the correct endpoint URL, and that the POST payload is valid JSON.
  • No results from Pinecone
    Confirm that documents were actually inserted into the ga_report_email index and that the embedding dimensions match the model you are using.
  • RAG Agent errors
    Check the Chat Model node credentials, verify the system prompt, and try a lower temperature for more stable outputs.
  • Google Sheets append failures
    Double-check the spreadsheet ID, the Log sheet name, and that the Google credential has write access.
  • Missing Slack alerts
    Verify the Slack credential, channel name, and that the Slack node is properly connected to the RAG Agent’s onError path.

Monitoring and scaling your setup

As usage grows, you will want to keep an eye on performance and resource usage.

  • Monitor workflow run times directly in n8n.
  • Set usage alerts for OpenAI and Pinecone so you are not surprised by costs.
  • Scale your Pinecone index resources if query latency starts creeping up.
  • For high-volume ingestion, consider batching or using asynchronous workers to stay under rate limits.

When this template is a perfect fit

You will get the most value from this n8n workflow if:

  • You send recurring GA reports that need commentary, not just raw metrics.
  • Stakeholders want quick, readable summaries with clear action items.
  • You want to reuse historical context from previous reports, not reinvent the wheel every week.

If that sounds familiar, this RAG-powered automation can save you a lot of time and mental energy.

Wrap-up and next steps

This GA Report Email workflow gives you a solid, extensible foundation for turning raw Google Analytics payloads into clear, actionable summaries. With Pinecone and OpenAI embeddings behind the scenes, the RAG agent can pull in relevant historical context and produce much richer output than a simple static template.

Try it in your own n8n instance

Ready to see it in action?

  1. Import the workflow into n8n.
  2. Configure your credentials for OpenAI, Pinecone, Google Sheets, and Slack.
  3. Send a test POST request to /webhook/ga-report-email with a GA report payload.

If you would like a pre-configured package or help tailoring this for your specific analytics setup, you can reply to this post to request a consultation or a downloadable workflow bundle.

Keywords: n8n, GA Report Email, RAG Agent, Pinecone, OpenAI embeddings, Google Sheets, Slack alert, automation template, GA report automation

BLE Beacon Mapper — n8n Workflow Guide

BLE Beacon Mapper: n8n Workflow Guide

Imagine turning a noisy stream of BLE beacon signals into clear, searchable insights that actually move your work forward. With the BLE Beacon Mapper n8n workflow, you can transform raw telemetry into structured knowledge, ready for search, analytics, and conversational queries. Instead of manually digging through logs, you get a system that learns, organizes, and answers questions for you.

This guide walks you through that transformation. You will see how the BLE Beacon Mapper template ingests beacon data, creates embeddings, stores them in Pinecone, and connects everything to a conversational agent. By the end, you will not just have a working workflow, you will have a foundation you can extend, experiment with, and adapt to your own automation journey.


From raw signals to meaningful insight

BLE (Bluetooth Low Energy) beacons are everywhere: in buildings, warehouses, retail spaces, campuses, and smart environments. They quietly broadcast proximity and presence data that can power:

  • Indoor positioning and navigation
  • Asset tracking and inventory visibility
  • Footfall analytics and space utilization

The challenge is not collecting this data. The challenge is making sense of it at scale. Raw telemetry is hard to search, difficult to connect with context, and time-consuming to analyze manually.

That is where mapping telemetry into a vector store becomes a breakthrough. By converting beacon events into embeddings and storing them in Pinecone, you unlock the ability to:

  • Search historical beacon events by context, such as location, device, or time
  • Ask natural language questions about beacon activity
  • Feed location-aware agents, dashboards, and automations with rich context

The BLE Beacon Mapper template uses n8n, Hugging Face embeddings, Pinecone, and an OpenAI-powered agent to create a modern BLE telemetry pipeline that works for you instead of against you.


Mindset: treating automation as a growth multiplier

Before diving into nodes and configuration, it helps to adopt the right mindset. This workflow is not just a technical recipe, it is a starting point for a more focused, automated way of working.

When you automate:

  • You free time for higher-value work instead of repetitive querying and manual log analysis.
  • You reduce human error and gain confidence that your data is consistently processed.
  • You create a foundation that can grow with your business, your telemetry volume, and your ideas.

Think of this BLE Beacon Mapper as your first step toward a larger automation ecosystem. Once you see how easily you can capture, store, and query beacon data, it becomes natural to ask: What else can I automate? That question is where real transformation begins.


The BLE Beacon Mapper at a glance

The workflow is built around a simple but powerful flow:

  1. Receive BLE telemetry through a webhook.
  2. Prepare and split the data into chunks.
  3. Generate embeddings using Hugging Face.
  4. Store vectors and metadata in a Pinecone index.
  5. Query Pinecone when you need context.
  6. Let an agent (OpenAI) reason over that context in natural language.
  7. Log events and outputs to Google Sheets for visibility.

Each step is handled by a dedicated n8n node, which you can configure, extend, and combine with your existing systems. Below, you will walk through the workflow stage by stage, so you can fully understand, customize, and build on it.


Stage 1: Ingesting BLE telemetry with a webhook

Webhook node: your gateway for beacon data

The journey starts with the Webhook node. This is your public endpoint where BLE gateways or aggregators send telemetry.

Key configuration:

  • httpMethod: POST
  • path: ble_beacon_mapper

Typical JSON payloads look like this:

{  "beacon_id": "beacon-123",  "rssi": -67,  "timestamp": "2025-08-31T12:34:56Z",  "gateway_id": "gw-01",  "metadata": { "floor": "2", "room": "A3" }
}

This is raw signal data. The workflow will turn it into something you can search and ask questions about.

Security tip: Protect this endpoint with an API key or signature verification on the gateway side, and ensure TLS is enforced. A secure webhook is a solid foundation for any production-grade automation.


Stage 2: Preparing data for embeddings

Splitter node: managing payload size intelligently

Once the webhook receives data, the Splitter node ensures that the payload is sized correctly for embedding. This becomes especially important when you ingest batched reports or telemetry with rich metadata.

Parameters used in the template:

  • chunkSize: 400
  • chunkOverlap: 40

For single-event messages, this node has minimal visible impact, but as your setup grows and you send larger batches, it helps you stay efficient and avoids hitting limits in downstream services.

Over time, you can tune these values to balance cost and recall, especially if you start embedding longer textual logs or enriched descriptions.


Stage 3: Turning telemetry into vectors

Embeddings (Hugging Face) node: creating a searchable representation

The Embeddings node is where your telemetry becomes machine-understandable. Each chunk of text is converted into a vector embedding using a Hugging Face model.

Key points:

  • The template uses the default Hugging Face model.
  • You can switch to a specialized or compact model optimized for short IoT telemetry.
  • Provide your Hugging Face API key using n8n credentials.

This step is what enables semantic search later. Instead of relying on exact string matches, you can find events that are similar in meaning or context, which is a huge step up from traditional log searches.

As your use case evolves, you can experiment with different models, measure search quality, and optimize for cost or performance. This is one of the easiest places to iterate and improve the workflow over time.


Stage 4: Persisting knowledge in Pinecone

Insert (Pinecone) node: building your vector index

After embeddings are generated, the Insert node writes them into a Pinecone index. In this template, the index is named ble_beacon_mapper.

Each document inserted into Pinecone should include rich metadata, such as:

  • beacon_id
  • timestamp
  • gateway_id
  • rssi
  • Location tags like floor, room, or asset type

This metadata unlocks powerful filtered queries. For example, you can search only for events on floor 2 or from a specific gateway, which keeps your results relevant and fast.

In n8n, you configure your Pinecone credentials and index details in the Insert node. Once this is set up, every incoming beacon event becomes part of a growing, searchable knowledge base.


Stage 5: Querying Pinecone and exposing it as a tool

Query node: retrieving relevant events

When you need context, the Query node reads from your Pinecone index. It can perform semantic nearest neighbor searches and apply metadata filters.

Typical usage includes:

  • Fetching the last N semantically similar events to a query.
  • Restricting results by location, gateway, or time window.
  • Providing a focused context set for the agent to reason over.

Tool node (Pinecone): connecting the agent to your data

The Tool node, named Pinecone in the template, wraps the vector store as an actionable tool for the agent. This means your conversational model can call the Pinecone tool when it needs more context, then use the retrieved events to craft a better answer.

Instead of a static chatbot, you get a context-aware agent that can reference your actual BLE telemetry in real time.


Stage 6: Conversational reasoning with memory

Memory, Chat, and Agent nodes: turning data into answers

This stage is where your automation becomes truly interactive. The combination of Memory, Chat, and Agent nodes allows an LLM (OpenAI in the template) to reason over the retrieved context and respond in natural language.

The agent can answer questions like:

  • “Where was beacon-123 most often detected this week?”
  • “Show me unusual signal patterns for gateway gw-01 today.”

The Memory node keeps short-term conversational context, so you can ask follow-up questions without repeating everything. This makes your beacon data accessible not just to engineers, but to anyone who can ask a question.

As you grow more comfortable, you can swap models, add guardrails, or extend the agent with additional tools, turning this into a powerful conversational analytics layer.


Stage 7: Logging to Google Sheets for visibility

Google Sheets (Sheet) node: creating a human-friendly log

To keep a simple, human-readable trail, the template includes a Google Sheets node that appends events or agent outputs to a spreadsheet.

Default configuration:

  • Sheet name: Log

This gives you:

  • A quick audit trail of processed events.
  • Fast reporting or sharing with non-technical stakeholders.
  • A place to store summaries generated by the agent alongside raw telemetry.

Over time, you can branch from this node to other destinations, such as BI tools, dashboards, or alerting systems, depending on how you want to grow your automation stack.


Deploying the BLE Beacon Mapper: step-by-step

Ready to make this workflow your own? Follow these steps to get the BLE Beacon Mapper running in your environment.

  1. Install n8n
    Use n8n Cloud, Docker, or a self-hosted installation, depending on your infrastructure and preferences.
  2. Import the workflow
    Load the supplied workflow JSON into your n8n instance. This gives you the complete BLE Beacon Mapper template.
  3. Configure credentials
    In n8n, set up the required credentials:
    • Hugging Face API key for the Embeddings node.
    • Pinecone API key and environment for the Insert and Query nodes.
    • OpenAI API key for the Chat node, or another supported LLM provider.
    • Google Sheets OAuth2 credentials for the Sheet node.
  4. Create your Pinecone index
    In Pinecone, create an index named ble_beacon_mapper with a dimension that matches your chosen embedding model.
  5. Expose and secure the webhook
    Ensure the webhook path is set to ble_beacon_mapper, secure it with API keys or signatures, and test connectivity using a sample POST request.
  6. Verify vector insertion and queries
    Monitor the Insert node to confirm that vectors are being written to Pinecone. Run test queries to validate that your index returns meaningful results.

Quick webhook test with curl

Use this command to verify your webhook is receiving data correctly:

curl -X POST https://your-n8n-instance/webhook/ble_beacon_mapper \  -H "Content-Type: application/json" \  -d '{"beacon_id":"beacon-123","rssi":-65,"timestamp":"2025-08-31T12:00:00Z","gateway_id":"gw-01","metadata":{"floor":"2"}}'

If everything is configured correctly, this event will flow through the workflow, be embedded, stored in Pinecone, and optionally logged to Google Sheets.


Tuning, best practices, and staying secure

Once the template is running, you can refine it so it fits your scale, budget, and security requirements. Think of this phase as iterating toward a workflow that truly matches how you work.

  • Chunk size
    For short telemetry, consider lowering chunkSize to 128-256 to reduce embedding cost. Increase it only if you start embedding longer textual logs.
  • Embedding model choice
    Use a compact Hugging Face model if cost or speed is a concern. Periodically evaluate recall and accuracy to ensure you are getting the insights you need.
  • Pinecone metadata filters
    Add metadata fields like floor, gateway, or asset type. This makes filtered queries faster and reduces irrelevant matches.
  • Retention strategy
    For high-volume telemetry, consider a TTL or regular pruning to keep index size manageable and costs predictable.
  • Webhook security
    Use HMAC or API keys, enforce TLS, and rate-limit the webhook to protect your n8n instance from abuse.
  • Observability
    Add logs or metrics, such as pushing counts to Prometheus or appending more details to Google Sheets, to help with troubleshooting and capacity planning.

Ideas to extend and evolve your workflow

The real power of n8n appears when you start customizing and extending templates. Once your BLE Beacon Mapper is live, you can gradually add new capabilities that align with your goals.

  • Geospatial visualization
    Map beacon IDs to coordinates, then feed that data into a mapping tool to visualize hotspots, traffic patterns, or asset locations.
  • Real-time alerts
    Combine this workflow with a rules engine to trigger notifications when a beacon enters or exits a zone, or when RSSI crosses a threshold.
  • Batch ingestion
    Accept batched telemetry from gateways and let the Splitter node intelligently chunk the data for embeddings and storage.
  • Model-assisted enrichment
    Use the Chat and Agent nodes to generate human-readable summaries of unusual beacon patterns and log those summaries automatically to Sheets or other systems.

Each small improvement compounds over time. Start with the core template, then let your real-world needs guide the next iteration.


Troubleshooting common issues

As you experiment, you might encounter a few common issues. Use these checks to get back on track quickly.

  • No vectors in Pinecone
    Confirm that the Embeddings node is returning vectors and that your Pinecone credentials and index name are correct.
  • Poor search results
    Try a different embedding model, adjust chunk size, or enrich your documents with more descriptive metadata.
  • Rate limits
    Stagger ingestion, use batching, or upgrade your API plans if you are consistently hitting provider limits.

Bringing it all together: your next step in automation

The BLE Beacon Mapper turns raw proximity events into a searchable knowledge base and a conversational interface. With n8n orchestrating Hugging Face embeddings, Pinecone vector search, and an OpenAI agent, you gain a flexible foundation for location-aware automation, analytics, and reporting that people can actually talk to.

This template is more than

Build a Fuel Price Monitor with n8n & Weaviate

Build a Fuel Price Monitor with n8n and Weaviate

Fuel pricing is highly dynamic and has a direct impact on logistics, fleet operations, retail margins, and end-customer costs. In environments where prices can change multiple times per day, manual monitoring is inefficient and error-prone. This guide explains how to implement a production-grade Fuel Price Monitor using n8n, Weaviate, Hugging Face embeddings, an Anthropic-powered agent, and Google Sheets for logging and auditability.

The workflow template described here provides an extensible, AI-driven pipeline that ingests fuel price updates, converts them into vector embeddings, stores them in Weaviate for semantic search, and uses an LLM-based agent to reason over historical data and trigger alerts.

Solution overview

The Fuel Price Monitor workflow in n8n is designed as a modular automation that can be integrated with existing data sources, monitoring tools, and reporting systems. At a high level, it:

  • Receives fuel price updates via a secure webhook
  • Splits and embeds text data using a Hugging Face model
  • Stores vectors and metadata in a Weaviate index for semantic retrieval
  • Exposes Weaviate as a tool to an Anthropic agent with memory
  • Evaluates price changes and anomalies, then logs outcomes to Google Sheets

This architecture provides a low-code, AI-enabled monitoring system that can be adapted to different fuel providers, geographies, and alerting rules.

Core components of the workflow

The template is built around several key n8n nodes and external services. Understanding their roles will help you customize the workflow for your own environment.

Webhook – ingestion layer

The Webhook node serves as the entry point for all fuel price updates. It is configured to accept POST requests with JSON payloads from scrapers, upstream APIs, or partner systems. A typical request body looks like:

{  "station": "Station A",  "fuel_type": "diesel",  "price": 1.239,  "timestamp": "2025-08-31T09:12:00Z",  "source": "provider-x"
}

Within the workflow, you should validate and normalize incoming fields so that downstream nodes receive consistent data types and formats. For example, standardize timestamps to ISO 8601 and enforce consistent naming for stations and fuel types.

Text Splitter – preparing content for embeddings

The Text Splitter node breaks long textual inputs into manageable chunks that can be embedded efficiently. This is especially useful if your payloads include additional descriptions, notes, or news-like content.

Recommended configuration:

  • Splitter type: character-based
  • Chunk size: for example, 400 characters
  • Chunk overlap: for example, 40 characters

Chunk overlap ensures that semantic context is preserved across boundaries while keeping embedding volumes and costs under control.

Embeddings (Hugging Face) – vectorization

Each text chunk is then passed to a Hugging Face Embeddings node. Using your Hugging Face API key, the node converts text into high-dimensional vectors that capture semantic meaning.

These embeddings are the foundation for semantic search and similarity queries in Weaviate. Choose an embedding model that aligns with your language and domain requirements to maximize retrieval quality.

Weaviate Insert – vector store and metadata

The Insert node writes vectors and associated metadata into a Weaviate index. In this template, the index (class) is named fuel_price_monitor.

For each record, store both the vector and structured attributes such as:

  • station
  • fuel_type
  • price
  • timestamp
  • source

This metadata enables precise filtering, aggregation, and analytics on top of semantic search results.

Weaviate Query and Tool – contextual retrieval

To support intelligent decision-making, the workflow uses a Query node that searches the Weaviate index and a Tool node that exposes these query capabilities to the agent.

Typical query patterns include:

  • Listing recent updates for a specific station and fuel type
  • Checking price changes over a defined time window
  • Comparing current prices to historical averages or thresholds

Example queries the agent might issue:

  • “Show me the last 10 diesel price updates near Station A.”
  • “Has diesel price at Station B changed by more than 5% in the last 24 hours?”

Memory and Agent (Anthropic) – reasoning layer

The workflow incorporates a Memory node connected to an Agent node configured with an Anthropic model (or another compatible LLM). The memory buffer stores recent interactions and relevant events, which gives the agent contextual awareness across multiple executions.

The agent uses:

  • Tool outputs from Weaviate queries
  • Conversation history or event history from the memory buffer
  • System and user prompts defining anomaly thresholds and actions

Based on this context, the agent can reason about trends, identify anomalies, and decide whether to trigger alerts or simply log the event.

Google Sheets – logging and audit trail

The final layer uses a Google Sheets node to append log entries to a sheet, for example a sheet named Log. Each row can capture:

  • Raw price update data
  • Derived metrics or anomaly flags
  • Agent decisions and explanations
  • Timestamps and identifiers for traceability

This provides a human-readable audit trail and a convenient data source for BI tools, dashboards, or further analysis.

Key benefits for automation professionals

  • Near real-time ingestion of fuel price changes via webhook-based integration.
  • Semantic search and retrieval using vector embeddings in Weaviate, enabling advanced historical analysis and anomaly detection.
  • AI-driven decision-making through an LLM agent with tools and memory, suitable for automated alerts and workflows.
  • Transparent logging in Google Sheets for compliance, reporting, and cross-team visibility.

Implementing the workflow in n8n

The sections below outline how to configure the main nodes in sequence and how they interact.

1. Configure the Webhook node

  1. Create a new workflow in n8n and add a Webhook node.
  2. Set the HTTP method to POST and define a path such as fuel_price_monitor.
  3. Optionally add authentication or IP restrictions to secure the endpoint.
  4. Implement basic validation or transformation to normalize fields (for example, ensure price is numeric, timestamp is ISO 8601, and source identifiers follow your internal conventions).

2. Add the Text Splitter node

  1. Connect the Webhook node to a Text Splitter node.
  2. Choose character-based splitting, with a chunk size near 400 characters and an overlap around 40 characters.
  3. Map the text field(s) you want to embed, such as combined descriptions or notes attached to the price update.

3. Generate embeddings with Hugging Face

  1. Add an Embeddings node configured to use a Hugging Face model.
  2. Provide your Hugging Face API key in the node credentials.
  3. Feed each chunk from the Text Splitter into the Embeddings node to produce vectors.

4. Insert vectors into Weaviate

  1. Add a Weaviate Insert node and connect it to the Embeddings node.
  2. Configure the Weaviate endpoint and authentication.
  3. Specify the index (class) name, for example fuel_price_monitor.
  4. Map the vector output from the Embeddings node and attach metadata such as station, fuel_type, price, timestamp, and source.

5. Configure Query and Tool nodes for retrieval

  1. Add a Weaviate Query node that can search the fuel_price_monitor index using filters and similarity search.
  2. Wrap the query in a Tool node so that the agent can invoke it dynamically during reasoning.
  3. Define parameters the agent can supply, such as station name, fuel type, time range, or maximum number of results.

6. Set up Memory and the Anthropic Agent

  1. Add a Memory node configured as a buffer for recent events or conversation context.
  2. Insert an Agent node configured with Anthropic as the LLM provider.
  3. Connect the Memory node to the Agent so the agent can read prior context.
  4. Attach the Tool node so the agent can call the Weaviate query as needed.
  5. Define a clear system prompt specifying:
    • What constitutes an anomaly (for example, a price change greater than 3 to 5 percent within 24 hours).
    • What actions are allowed (such as logging, alerting, or summarization).
    • Any constraints or safeguards, including when to escalate versus silently log.

7. Log outcomes to Google Sheets

  1. Add a Google Sheets node and connect it after the Agent node.
  2. Authenticate with your Google account and select the target spreadsheet.
  3. Use an operation such as “Append” and target a sheet called Log or similar.
  4. Map fields including the original payload, computed anomaly indicators, agent decisions, and timestamps.

Best practices for a reliable fuel price monitoring pipeline

Normalize and standardize payloads

Consistent data is critical for accurate retrieval and analysis. At ingestion time:

  • Normalize currency representation and units.
  • Use ISO 8601 timestamps across all sources.
  • Standardize station identifiers and fuel type labels to avoid duplicates or mismatches.

Optimize your embedding strategy

Model selection and chunking parameters influence both quality and cost:

  • Choose an embeddings model suited to your language and technical domain.
  • If your payloads are numeric-heavy, add short human-readable context around key values to improve semantic retrieval.
  • Avoid embedding trivial fields individually, and rely on metadata for structured filtering.

Manage vector store growth

Vector databases can grow quickly if every update is stored indefinitely. To manage scale and cost:

  • Set sensible chunk sizes and avoid excessive duplication across chunks.
  • Use Weaviate metadata filters such as fuel_type and station to narrow queries and reduce compute.
  • Periodically prune or aggregate older entries, for example keep monthly summaries instead of all raw events.

Design robust agent prompts

Prompt engineering is essential for predictable agent behavior:

  • Explicitly define anomaly thresholds and acceptable tolerance ranges.
  • List the exact actions the agent can perform, such as logging, alerting, or requesting more data.
  • Restrict write operations and always log the agent’s decisions and reasoning to Google Sheets.

Testing and validation

Before deploying the workflow to production, validate each stage end to end:

  1. Webhook and splitting Send sample payloads to the webhook and confirm that the Text Splitter produces the expected chunks.
  2. Embeddings and Weaviate storage Verify that embeddings are successfully generated and that records appear in the fuel_price_monitor index with correct metadata.
  3. Query relevance Execute sample queries against Weaviate and confirm that results align with the requested station, fuel type, and time frame.
  4. Agent behavior and logging Test scenarios with both normal and anomalous price changes. Ensure the agent’s decisions are sensible and that all events are logged correctly in Google Sheets.

Scaling and cost control

As ingestion volume grows, embedding and LLM usage can become significant cost drivers. To manage this:

  • Batch non-critical updates and process them during off-peak times.
  • Implement retention policies to remove low-value vectors or compress historical data into summaries.
  • Use cost-effective embedding models for routine indexing and reserve higher quality models for query-time refinement or critical analyses.

Security and compliance considerations

Fuel price data may be sensitive in competitive or regulated environments. To protect your pipeline:

  • Secure webhook endpoints with authentication tokens, API keys, or IP allowlists.
  • Encrypt sensitive fields before storing them in Weaviate if they could identify individuals or confidential business relationships.
  • Define clear audit and retention policies, and use Google Sheets logs as part of your compliance documentation.

Troubleshooting common issues

  • No vectors appearing in Weaviate Verify your Hugging Face API credentials, ensure the Embeddings node is producing outputs, and confirm that these outputs are mapped correctly into the Weaviate Insert node.
  • Poor or irrelevant search results Increase chunk overlap, experiment with different embedding models, or enrich the text with additional context. Also review your query filters and similarity thresholds.
  • Unstable or inconsistent agent decisions Refine the system prompt, add explicit examples of desired behavior, and adjust anomaly rules. Consider tightening the agent’s tool access or limiting its possible actions.

Potential extensions and enhancements

Once the core Fuel Price Monitor is running, you can extend it with additional automation and analytics capabilities:

  • Integrate Slack, Microsoft Teams, or SMS providers for real-time alerts to operations teams.
  • Incorporate geospatial metadata to identify and surface the nearest stations for a given location.
  • Train a lightweight classification model on historical data to flag suspicious entries or potential price manipulation.

Conclusion

By combining n8n, Weaviate, Hugging Face embeddings, and an Anthropic-based agent, you can build a sophisticated Fuel Price Monitor that delivers semantic search, intelligent anomaly detection, and comprehensive audit logs with minimal custom code.

Start from the template, plug in your Hugging Face, Weaviate, and Anthropic credentials, and send a sample payload to the webhook to validate the pipeline. From there, refine thresholds, prompts, and integrations to align with your operational requirements.

Ready to deploy your own Fuel Price Monitor? Clone the template into your n8n instance, connect your services, and begin tracking fuel price changes with an automation-first, AI-enhanced approach.

Get the Workflow Template