Etsy Review to Slack — n8n RAG Workflow

Etsy Review to Slack – n8n RAG Workflow For Focused, Automated Growth

Imagine opening Slack each morning and already knowing which Etsy reviews need your attention, which customers are delighted, and which issues are quietly hurting your business. No more manual checking, no more missed feedback, just clear, organized insight flowing straight into your workspace.

This is exactly what the Etsy Review to Slack n8n workflow template makes possible. It captures incoming Etsy reviews, converts them into embeddings, stores and queries context in Supabase, enriches everything with a RAG agent, logs outcomes to Google Sheets, and raises Slack alerts on errors or urgent feedback. In other words, it turns scattered customer reviews into a reliable, automated signal for growth.

From Reactive To Proactive – The Problem This Workflow Solves

Most teams treat customer reviews as something to “check when we have time.” That often means:

  • Manually logging into Etsy to skim recent reviews
  • Missing critical negative feedback until it is too late
  • Copying and pasting reviews into spreadsheets for tracking
  • Relying on memory to see patterns or recurring issues

Yet customer reviews are a goldmine for product improvement, customer success, and marketing. When they are buried in dashboards or scattered across tools, you lose opportunities to respond quickly, learn faster, and build stronger relationships.

Automation changes that. By connecting Etsy reviews directly into Slack, enriched with context and logged for analysis, you move from reactive firefighting to proactive, data-driven decision making. And you do it without adding more manual work to your day.

Shifting Your Mindset – Automation As A Growth Lever

This template is more than a technical setup. It is a mindset shift. Instead of thinking, “I have to remember to check reviews,” you design a system where reviews come to you, already summarized, scored, and ready for action.

With n8n, you are not just automating a single task, you are building a reusable automation habit:

  • Start small with one workflow
  • Save time and reduce manual effort
  • Use that time to improve and extend your automations
  • Slowly build a more focused, scalable operations stack

Think of this Etsy Review to Slack workflow as a stepping stone. Once you see how much time and mental energy it saves, it becomes natural to ask, “What else can I automate?”

The Workflow At A Glance – How The Pieces Fit Together

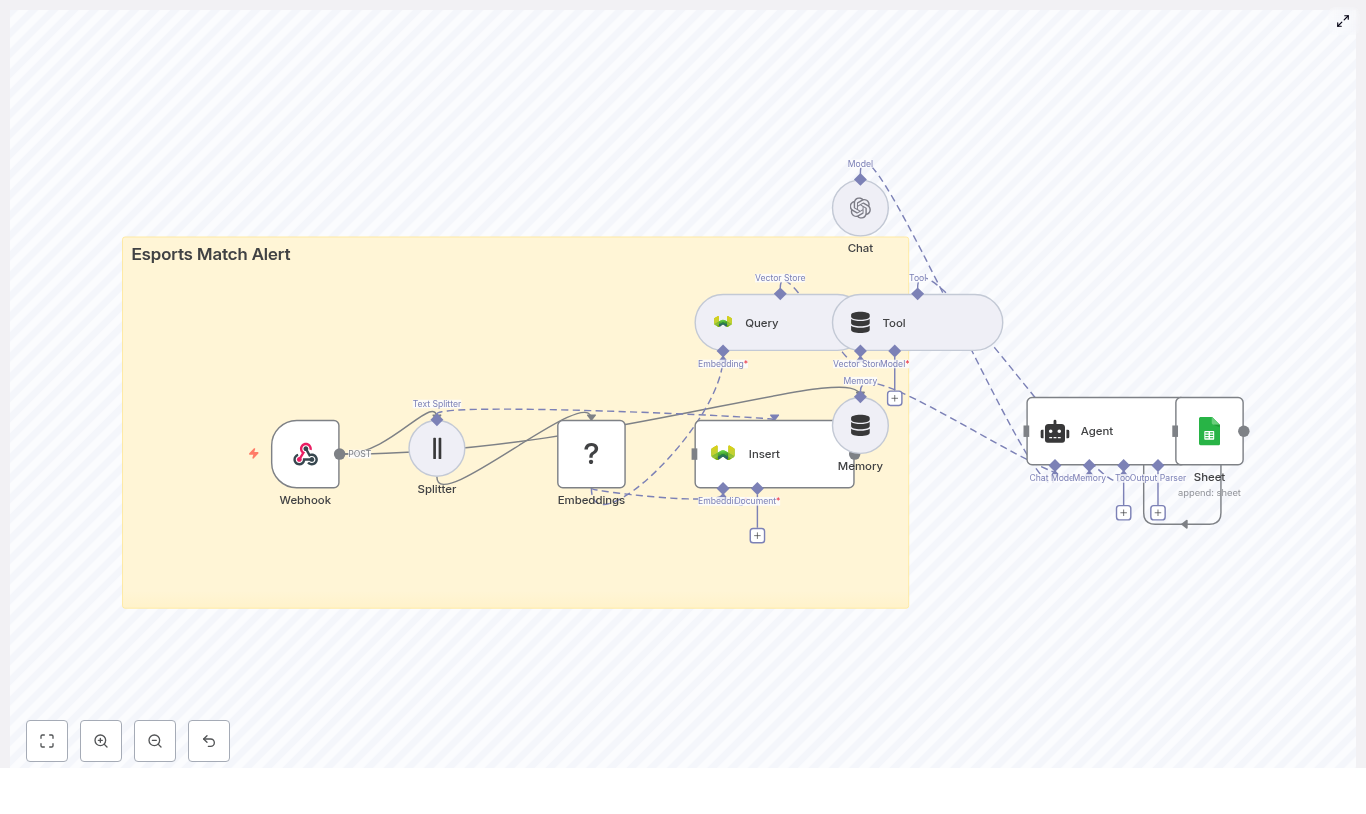
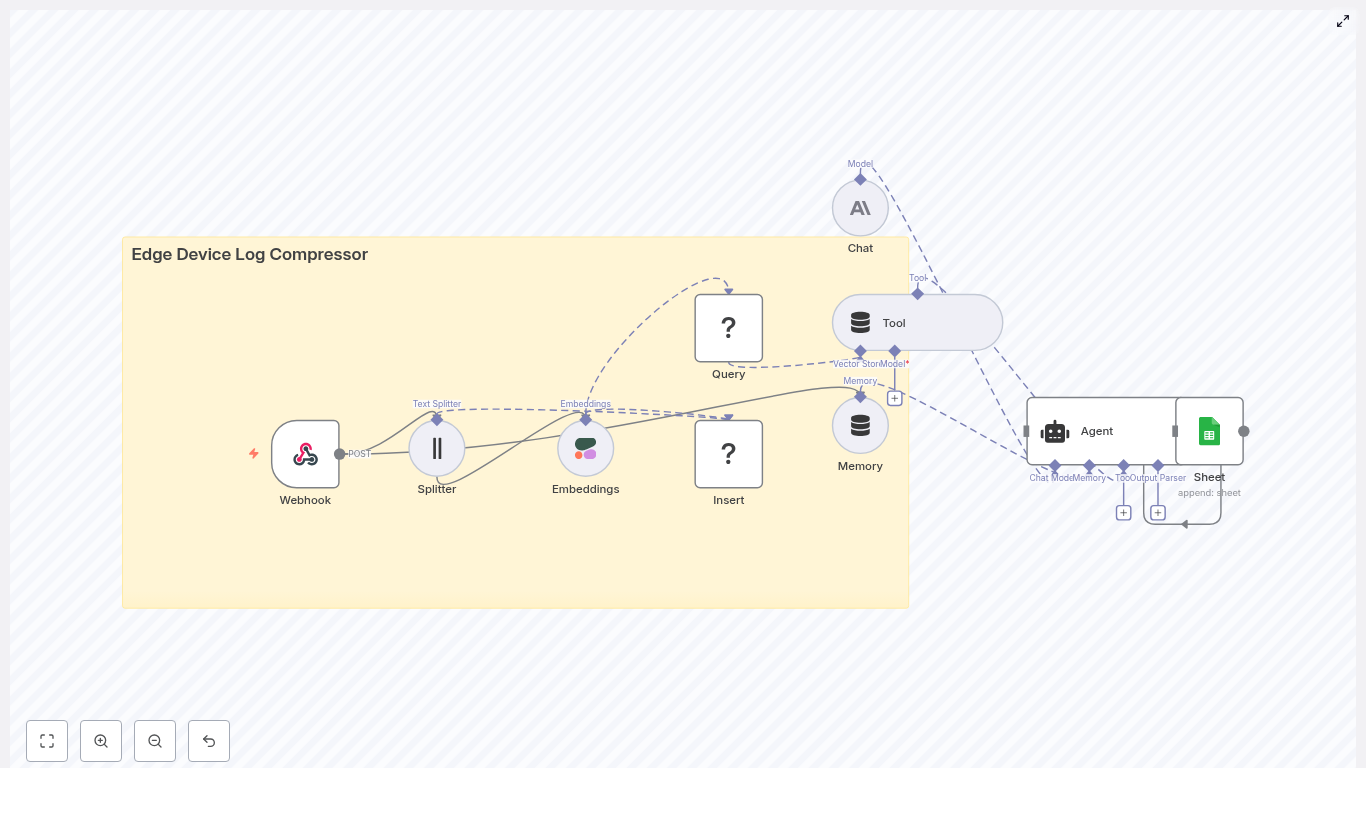
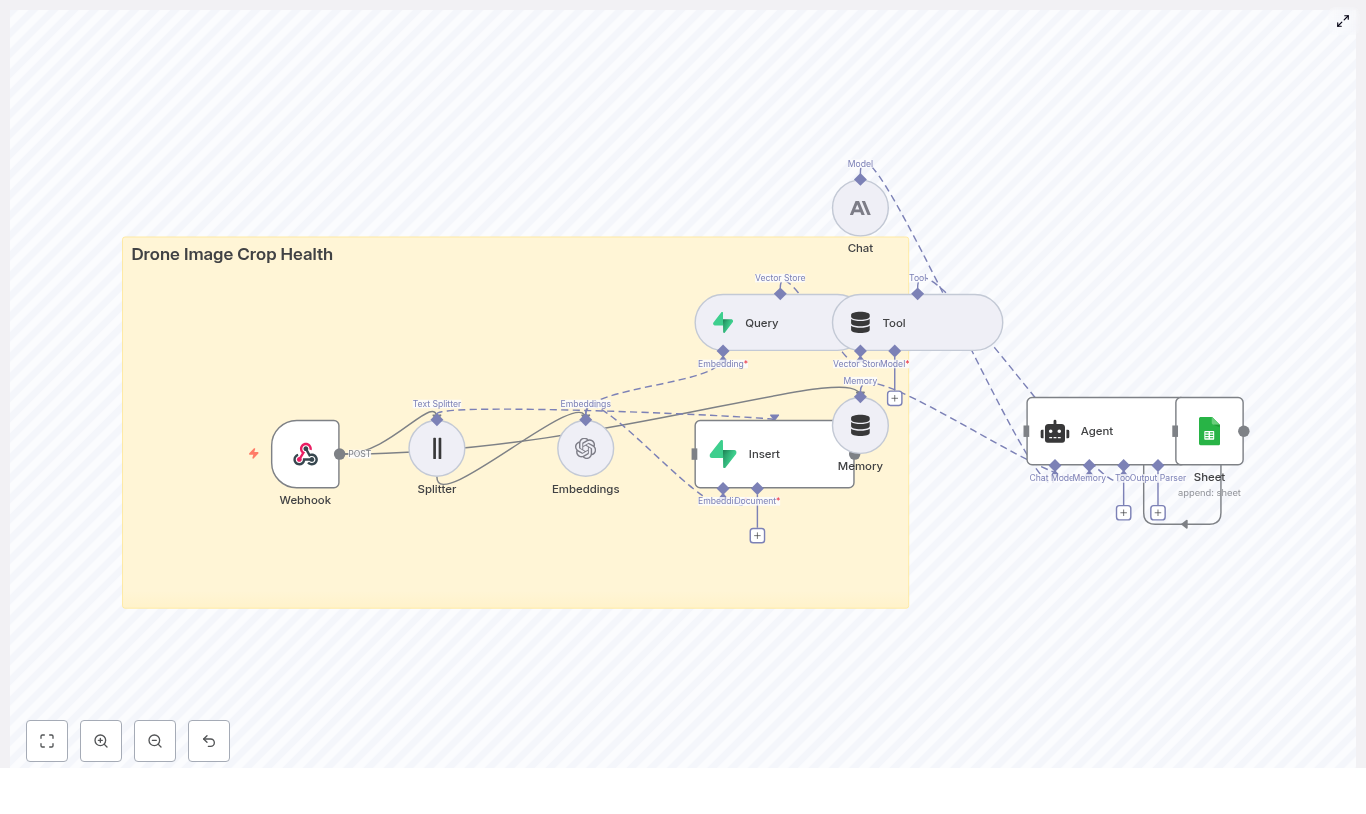
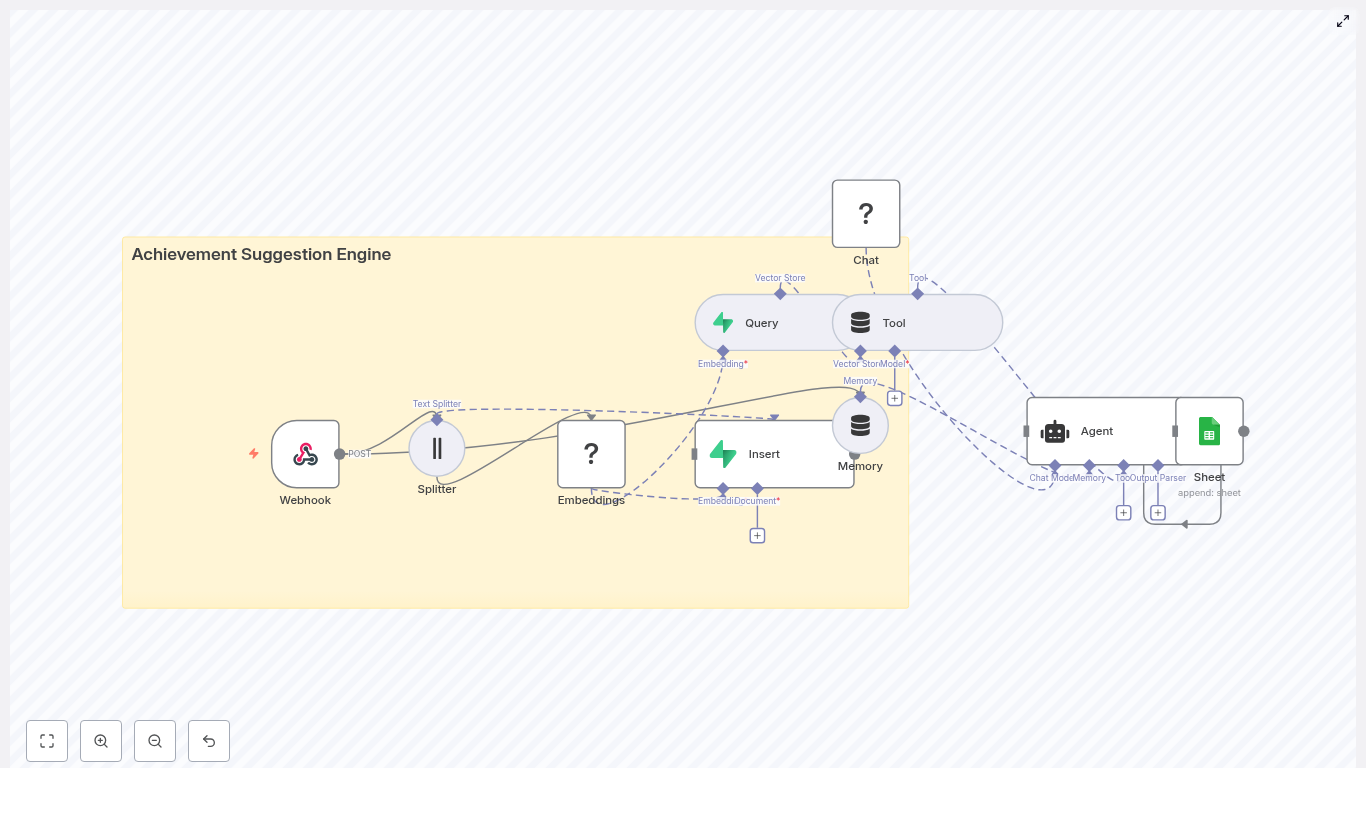
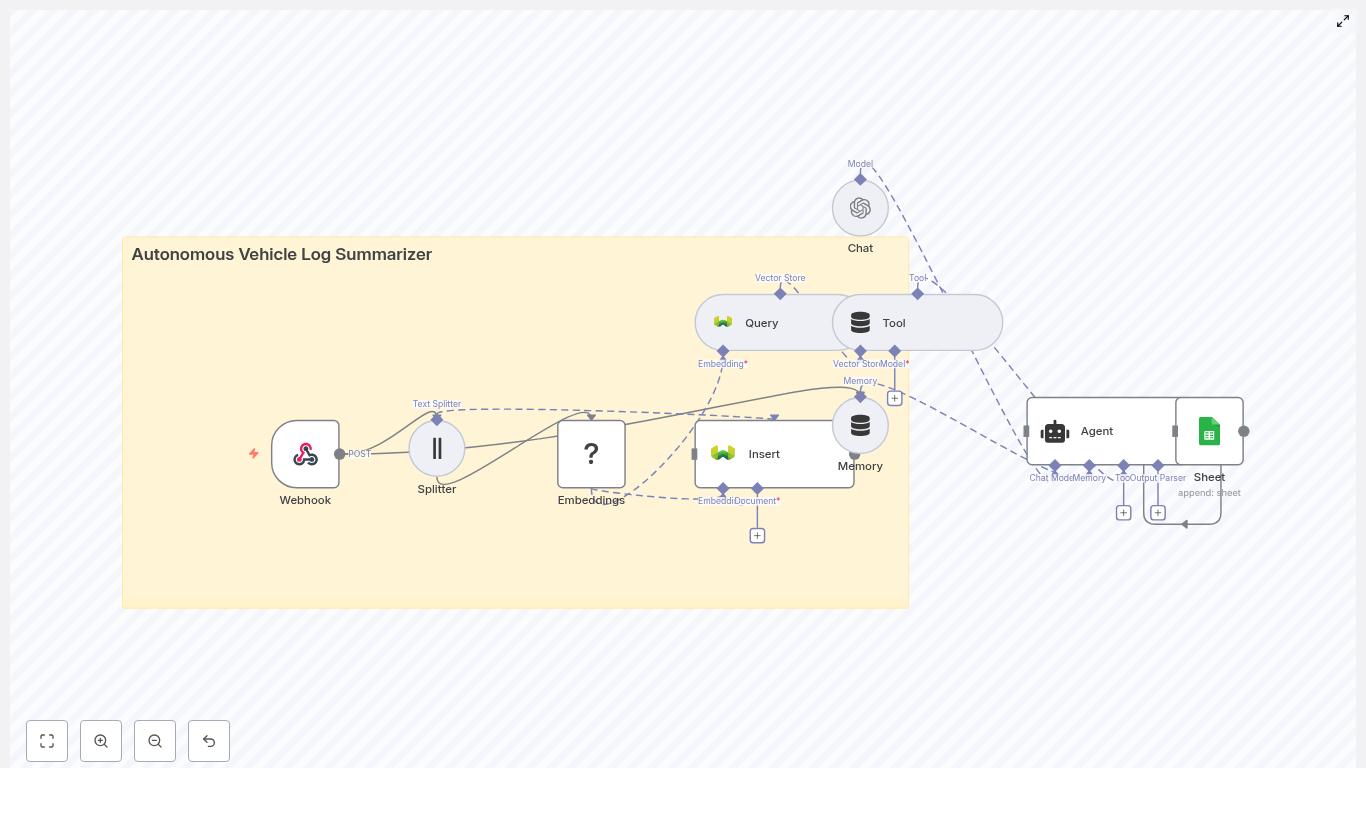
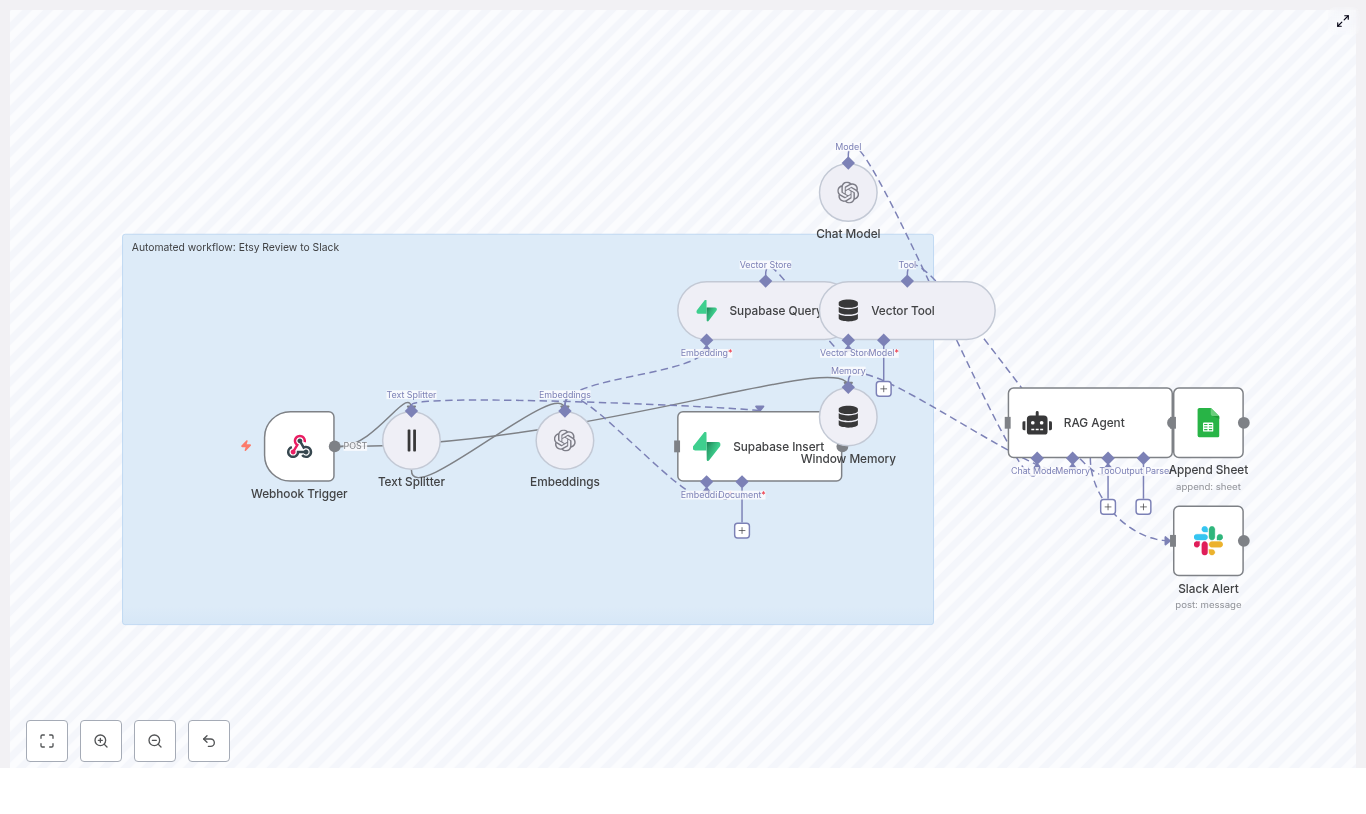
Under the hood, this n8n template connects a powerful set of tools, all working together to deliver intelligent review insights to Slack:

  • Webhook Trigger – Receives Etsy review payloads at POST /etsy-review-to-slack
  • Text Splitter – Breaks long reviews into smaller chunks for embeddings
  • Embeddings (OpenAI) – Creates vector representations using text-embedding-3-small
  • Supabase Insert & Query – Stores vectors in a Supabase vector table, then queries them for context
  • Window Memory + Vector Tool – Gives the RAG agent access to relevant past reviews and short-term context
  • RAG Agent – Summarizes, scores sentiment, and recommends actions
  • Append Sheet (Google Sheets) – Logs results for auditability and future analytics
  • Slack Alert – Posts error messages or high-priority notifications in Slack

Each node plays a specific role. Together, they form a workflow that quietly runs in the background, turning raw reviews into actionable insight.

Step 1 – Capturing Reviews Automatically With The Webhook Trigger

Your journey starts with a simple but powerful step: receiving Etsy reviews in real time.

Webhook Trigger

In n8n, configure a public webhook route with the path /etsy-review-to-slack. Then point your Etsy webhooks or integration script to that URL.

Whenever a review is created or updated, Etsy sends the review JSON payload to this endpoint. That payload becomes the starting input for your workflow, no manual check-ins required.

Step 2 – Preparing Text For AI With The Text Splitter & Embeddings

To make your reviews searchable and context-aware, the workflow converts them into embeddings. Before that happens, the text is prepared for optimal performance and cost.

Text Splitter

Long reviews or combined metadata can exceed safe input sizes for embeddings. The Text Splitter node breaks the content into manageable chunks so your AI tools can process it safely and effectively.

Recommended settings from the template:

  • chunkSize: 400
  • chunkOverlap: 40

This balance keeps semantic coherence while minimizing truncation and unnecessary cost.

Embeddings (OpenAI)

Next, each chunk is converted into a dense vector using an embeddings provider. The template uses OpenAI with the model text-embedding-3-small, which is a practical balance between cost and quality for short review text.

Each vector represents the meaning of that chunk. Those vectors are what make it possible for the workflow to later retrieve similar reviews, detect patterns, and provide context to the RAG agent.

Step 3 – Building Your Knowledge Base In Supabase

Instead of letting reviews disappear into the past, this workflow turns them into a growing knowledge base that your agent can draw from over time.

Supabase Insert & Supabase Query

Every embedding chunk is inserted into a Supabase vector table with a consistent index name. In this template, the index/table is named etsy_review_to_slack.

Alongside the vectors, you can store metadata like:

  • Review ID
  • Order ID
  • Rating
  • Date
  • Source

This metadata lets you filter, de-duplicate, and manage retention over time. When a new review comes in, the Supabase Query node retrieves the most relevant vectors. That context is then passed to the RAG agent so it can interpret the new review in light of similar past feedback.

Step 4 – Giving The Agent Context With Vector Tool & Memory

To move beyond simple keyword alerts, your workflow needs context. That is where the Vector Tool and Window Memory come in.

Vector Tool

The Vector Tool acts like a LangChain-style tool that lets the agent query the vector store. It can pull in related prior reviews, notes, or any other stored context so the agent is not working in isolation.

Window Memory

Window Memory preserves short-term conversational context. If multiple related events are processed close together, the agent can produce more coherent outputs. This is especially helpful if you are processing a burst of reviews related to a specific product or incident.

Step 5 – Turning Raw Reviews Into Action With The RAG Agent

This is where the workflow starts to feel truly intelligent. The RAG agent receives the review content, the retrieved vector context, and the memory, then generates an enriched response.

RAG Agent Configuration

The agent is configured with a system message such as:

“You are an assistant for Etsy Review to Slack”

Based on your prompt, it can:

  • Summarize the review
  • Score sentiment
  • Label the review as OK or needing escalation
  • Recommend follow-up actions (for example, escalate to support or respond with a specific tone)

The output is plain text that can be logged, analyzed, and used to decide how to route the review in Slack or other tools.

Step 6 – Logging Everything In Google Sheets For Clarity

Automation should not feel like a black box. To keep everything transparent and auditable, the workflow logs each processed review in a Google Sheet.

Append Sheet

Using the Append Sheet node, every processed review is added to a sheet named Log. The agent output is mapped to columns, such as a Status column for “OK” or “Escalate,” plus fields for summary, sentiment, or suggested action.

This gives you:

  • A simple audit trail
  • Data for dashboards and trend analysis
  • A quick way to review how the agent is performing over time

Step 7 – Staying In Control With Slack Alerts

Finally, the workflow brings everything to the place where your team already lives: Slack.

Slack Alert

The Slack node posts messages to an alerts channel, for example #alerts. You can configure it to:

  • Notify on workflow errors
  • Highlight reviews that require urgent attention
  • Share summaries of high-impact feedback

The template includes a failure path that posts messages like:

“Etsy Review to Slack error: {$json.error.message}”

This keeps you informed if something breaks so you can fix it fast and keep your automation reliable.

Deployment Checklist – Get Your Workflow Live

To turn this into a production-ready system, walk through this checklist:

  1. An n8n instance reachable from Etsy (public or via a tunnel such as ngrok).
  2. An OpenAI API key configured in n8n credentials if you use OpenAI embeddings and chat models.
  3. A Supabase project with vector store enabled and an index/table named etsy_review_to_slack.
  4. Google Sheets OAuth2 credentials with permission to append to your Log sheet.
  5. A Slack app token with permission to post messages in your chosen channel.
  6. A test Etsy webhook so you can confirm the payload format matches what your workflow expects.

Once these are in place, you are ready to run test reviews and watch the automation come to life.

Configuration Tips To Make The Workflow Truly Yours

Chunk Size And Overlap

Adjust chunkSize based on your typical review length. Larger chunks mean fewer embeddings and lower cost, but less granularity. As a guideline, 200-500 tokens with 10-20 percent overlap is a safe default for most setups.

Choosing The Right Embedding Model

For short Etsy reviews, compact models often give you the best cost-to-quality ratio. The template uses text-embedding-3-small, which is well suited for this use case. You can experiment with other models if you need more nuance or have longer content.

Supabase Schema And Retention Strategy

To keep your vector store efficient over time:

  • Store metadata such as review ID, rating, date, and source
  • Use that metadata to filter or de-duplicate entries
  • Implement a retention policy, for example archiving old vectors or rotating indexes monthly

This keeps your queries fast and costs predictable while still preserving the context that matters.

Error Handling And Observability

Use a combination of Slack alerts and Google Sheets logs to monitor workflow health. Consider adding retry logic for transient issues such as network hiccups or rate limits. The more visible your automation is, the more confidently you can rely on it.

Sample Prompt For The RAG Agent

You can fully customize the agent prompt to match your brand voice and escalation rules. Here is a sample prompt you can start with, then refine as you learn:

System: You are an assistant for Etsy Review to Slack. Summarize the review and mark if it should be escalated.
User: {{review_text}}
Context: {{vector_context}}
Output: Provide a one-line status (OK / Escalate), short summary (1-2 sentences), and suggested action.

Run a few reviews through this prompt, see how it behaves, then fine-tune the wording to better match your internal workflows.

Troubleshooting Common Issues

If something does not work on the first try, you are not failing, you are iterating. Here are common issues and what to check:

  • Missing or malformed webhook payload – Verify your Etsy webhook settings and test with a known payload.
  • Embeddings failing – Confirm your OpenAI credentials, chosen model, and check for rate limits.
  • Supabase insert errors – Ensure the vector table exists and your Supabase API key has insert privileges.
  • Slack post failures – Check token scopes and confirm that the app is a member of the target Slack channel.

Each fix makes your automation more robust and sets you up for future workflows.

Ideas To Extend And Evolve This Workflow

Once the core Etsy Review to Slack pipeline is running smoothly, you can build on it to support more advanced use cases:

  • Automatic reply drafts – Let the agent draft responses that a customer support rep can review and send.
  • Sentiment dashboards – Feed Google Sheets data into a BI tool or dashboard to track sentiment trends over time.
  • Tagging and routing – Route reviews to different Slack channels based on product, category, or issue type.
  • Multi-lingual handling – Add a translation step for international reviews before generating embeddings.

Each extension is another step toward a fully automated, insight-driven customer feedback loop.

Security And Privacy – Automate Responsibly

Customer reviews often contain personal information. As you automate, keep security and privacy front of mind:

  • Avoid logging sensitive fields in public sheets or channels
  • Use limited-scope API keys and rotate credentials regularly
  • Configure Supabase row-level policies or encryption where needed

Thoughtful design here ensures you gain the benefits of automation without compromising your customers’ trust.

Bringing It All Together – Your Next Step

This n8n Etsy Review to Slack workflow gives you a scalable way to capture customer feedback, enrich it with historical context, and route actionable insights to your team in real time. It is a practical, production-ready example of how automation and AI can free you from repetitive checks and help you focus on what matters most: improving your products and serving your customers.

You do not have to build everything at once. Start with the template, deploy it in your n8n instance, and:

  • Run a few test reviews through the workflow
  • Tune the RAG agent prompt to match your tone and escalation rules
  • Adjust chunk sizes, retention policies, and Slack routing as you learn

Each small improvement compounds. Over time, you will not just have an automated review pipeline, you will have a smarter, calmer way of running your business.

Call to action: Deploy the workflow, experiment with it, and treat it as your starting point for a more automated, focused operation. If you need help refining prompts, designing retention policies, or expanding Slack routing, connect with your automation engineer or a consultant who knows n8n and vector stores. You are only a few iterations away from a powerful, always-on feedback engine.

Build an Esports Match Alert Pipeline with n8n

Build an Esports Match Alert Pipeline with n8n, LangChain & Weaviate

High frequency esports events generate a continuous flow of structured and unstructured data. Automating how this information is captured, enriched, and distributed is essential for operations teams, broadcast talent, and analytics stakeholders. This guide explains how to implement a production-ready Esports Match Alert pipeline in n8n that combines LangChain, Hugging Face embeddings, Weaviate as a vector store, and Google Sheets for logging and auditing.

The workflow template processes webhook events, transforms raw payloads into embeddings, persists them in a vector database, runs semantic queries, uses an LLM-driven agent for enrichment, and finally records each event in a Google Sheet. The result is a scalable, context-aware alert system that minimizes custom code while remaining highly configurable.

Why automate esports match alerts?

Modern esports operations generate a wide range of events such as lobby creation, roster updates, score changes, and match conclusions. Manually tracking and broadcasting these updates is error prone and does not scale. An automated alert pipeline built with n8n and a vector database can:

  • Deliver real-time match notifications to Slack, Discord, or internal dashboards
  • Enrich alerts with historical context via vector search, for example prior matchups or comeback patterns
  • Maintain a structured audit trail in Google Sheets or downstream analytics systems
  • Scale horizontally by orchestrating managed services instead of maintaining monolithic custom applications

For automation engineers and operations architects, this approach provides a reusable pattern for combining event ingestion, semantic search, and LLM-based reasoning in a single workflow.

Solution architecture overview

The n8n template implements an end-to-end pipeline with the following high-level stages:

  1. Event ingestion via an n8n Webhook node
  2. Preprocessing and chunking of text for efficient embedding
  3. Embedding generation using Hugging Face or a compatible provider
  4. Vector storage in a Weaviate index with rich metadata
  5. Semantic querying exposed as a Tool for a LangChain Agent
  6. Agent reasoning with short-term memory to generate enriched alerts
  7. Logging of each processed event to Google Sheets for audit and analytics

Although the example focuses on esports matches, the architecture is generic and can be repurposed for any event-driven notification system that benefits from semantic context.

Prerequisites and required services

Before deploying the template, ensure you have access to the following components:

  • n8n – Self-hosted or n8n Cloud instance to run and manage workflows
  • Hugging Face – API key for generating text embeddings (or an equivalent embedding provider)
  • Weaviate – Managed or self-hosted vector database for storing embeddings and metadata
  • OpenAI (optional) – Or another LLM provider for advanced language model enrichment
  • Google account – Google Sheets API credentials for logging and audit trails

API keys and credentials should be stored using n8n credentials and environment variables to maintain security and operational hygiene.

Key workflow components in n8n

Webhook-based event ingestion

The entry point for the pipeline is an n8n Webhook node configured with method POST. For example, you might expose the path /esports_match_alert. Your match producer (game server, tournament API, or scheduling system) sends JSON payloads to this endpoint.

// Example match payload
{  "match_id": "12345",  "event": "match_start",  "team_a": "Blue Raptors",  "team_b": "Crimson Wolves",  "start_time": "2025-09-01T17:00:00Z",  "metadata": { "tournament": "Summer Cup" }
}

Typical event types include match_start, match_end, score_update, roster_change, and match_cancelled. The webhook node ensures each event is reliably captured and passed into the processing pipeline.

Text preprocessing and chunking

To prepare data for embedding, the workflow uses a Text Splitter (or equivalent text processing logic) to break long descriptions, commentary, or metadata into smaller segments. A common configuration is:

  • Chunk size: 400 tokens or characters
  • Chunk overlap: 40

This strategy helps preserve context across chunks while keeping each segment within the optimal length for embedding models. Adjusting these parameters is a key tuning lever for both quality and cost.

Embedding generation with Hugging Face

Each text chunk is passed to a Hugging Face embeddings node (or another embedding provider). The node produces vector representations that capture semantic meaning. Alongside the vector, you should attach structured metadata such as:

  • match_id
  • Team names
  • Tournament identifier
  • Event type (for example match_start, score_update)
  • Timestamps and region

Persisting this metadata enables powerful hybrid queries that combine vector similarity with filters on match attributes.

Vector storage in Weaviate

Embeddings and metadata are then written to Weaviate using an Insert node. A typical class or index name might be esports_match_alert. Once stored, Weaviate supports efficient semantic queries such as:

  • “Recent matches involving Blue Raptors”
  • “Matches with late-game comebacks in the Summer Cup”

Configuring the schema with appropriate properties for teams, tournaments, event types, and timestamps is recommended to facilitate advanced filtering and analytics.

Semantic queries as LangChain tools

When a new event arrives, the workflow can query historical context from Weaviate. An n8n Query node is used to perform vector search against the esports_match_alert index. In the template, this query capability is exposed to the LangChain Agent as a Tool.

The agent can invoke this Tool on demand, for example to retrieve prior meetings between the same teams or similar match scenarios. This pattern keeps the agent stateless with respect to storage while still giving it on-demand access to rich, semantically indexed history.

LangChain Agent and short-term memory

The enrichment layer is handled by a LangChain Agent configured with a chat-based LLM such as OpenAI’s models. A buffer window or short-term memory component is attached to retain recent conversation context and reduce repetitive prompts.

The agent receives:

  • The current match payload
  • Any relevant vector search results from Weaviate
  • System and developer prompts that define tone, structure, and output format

Based on this context, the agent can generate:

  • Human readable alert messages suitable for Discord or Slack
  • Recommendations on which channels or roles to notify
  • Structured metadata for logging, such as sentiment, predicted match intensity, or notable historical references

An example agent output that could be posted to a messaging platform:

Blue Raptors vs Crimson Wolves starting now! Scheduled: 2025-09-01T17:00Z
Previous meeting: Blue Raptors won 2-1 (2025-08-15). Predicted outcome based on form: Close match. #SummerCup

Audit logging in Google Sheets

As a final step, the workflow appends a row to a designated Google Sheet using the Google Sheets node. Typical columns include:

  • match_id
  • event type
  • Generated alert text
  • Embedding or vector record identifiers
  • Timestamp of processing
  • Delivery status or target channels

This provides a lightweight, accessible log for debugging, reporting, and downstream analytics. It also allows non-technical stakeholders to review the system behavior without accessing infrastructure dashboards.

End-to-end setup guide in n8n

1. Configure the Webhook node

  • Create a new workflow in n8n.
  • Add a Webhook node with method POST.
  • Set a path such as /esports_match_alert.
  • Secure the endpoint with a secret token or signature verification mechanism.

2. Implement text splitting

  • Feed relevant fields from the incoming payload (for example descriptions, match summaries, notes) into a Text Splitter node.
  • Start with chunk size 400 and overlap 40, then adjust based on payload length and embedding cost.

3. Generate embeddings

  • Add a Hugging Face Embeddings node.
  • Configure the desired model and connect credentials.
  • Map each text chunk as input and attach metadata fields such as match_id, teams, tournament, event type, and timestamp.

4. Insert vectors into Weaviate

  • Set up a Weaviate Insert node.
  • Define a class or index name, for example esports_match_alert.
  • Map the vectors and metadata from the embedding node into the Weaviate schema.

5. Configure semantic queries

  • Add a Weaviate Query node to perform similarity searches.
  • Use the current match payload (for example team names or event description) as the query text.
  • Optionally filter by tournament, region, or time window using metadata filters.

6. Set up the LangChain Agent and memory

  • Add a LangChain Agent node configured with a Chat model (OpenAI or another provider).
  • Attach a short-term memory component (buffer window) so the agent can reference recent exchanges.
  • Expose the Weaviate Query node as a Tool, enabling the agent to call it when it needs historical context.
  • Design prompts that instruct the agent to produce concise, broadcast-ready alerts and structured metadata.

7. Append logs to Google Sheets

  • Connect a Google Sheets node at the end of the workflow.
  • Use OAuth credentials with restricted access, ideally a service account.
  • Append a row with key fields such as match_id, event type, generated message, vector IDs, timestamp, and delivery status.

Best practices for a robust alert pipeline

Designing metadata for precision queries

Effective use of Weaviate depends on high quality metadata. At minimum, consider storing:

  • match_id and tournament identifiers
  • Team names and player rosters
  • Event type and phase (group stage, playoffs, finals)
  • Region, league, and organizer
  • Match and processing timestamps

This enables hybrid queries that combine semantic similarity with strict filters, for example “similar matches but only in the same tournament and region, within the last 30 days.”

Optimizing chunking and embedding cost

Chunk size and overlap directly affect both embedding quality and API costs. Larger chunks capture more context but increase token usage. Use the template defaults (400 / 40) as a baseline, then:

  • Increase chunk size for long narrative descriptions or full match reports.
  • Decrease chunk size if payloads are short or if you need to reduce cost.
  • Monitor retrieval quality by sampling query results and adjusting accordingly.

Handling rate limits and batching

To keep the system resilient under load:

  • Batch embedding requests where supported by the provider.
  • Use n8n’s error handling to implement retry and backoff strategies.
  • Configure concurrency limits in n8n to respect provider rate limits.

Security and access control

  • Protect the webhook using a secret token and, where possible, signature verification of incoming requests.
  • Store Hugging Face, Weaviate, and LLM provider keys in n8n credentials or environment variables, not in workflow code.
  • Use OAuth for Google Sheets, with a dedicated service account and restricted sheet permissions.
  • Restrict network access to self-hosted Weaviate instances and n8n where applicable.

Troubleshooting and performance tuning

  • Irrelevant or noisy embeddings Validate the embedding model choice and review your chunking strategy. Overly large or small chunks can degrade semantic quality.
  • Missing or incomplete Google Sheets entries Confirm that OAuth scopes allow append operations and that the configured account has write permissions to the target sheet.
  • Slow semantic queries Check Weaviate indexing status and resource allocation. Consider enabling approximate nearest neighbor search and scaling memory/CPU for high traffic scenarios.
  • Unreliable webhook delivery Implement signature checks, and optionally queue incoming events in a temporary store (for example Redis or a database) before processing to support retries.

Scaling and extending the workflow

As event volume and stakeholder requirements grow, you can extend the pipeline in several ways:

  • Move Weaviate to a managed cluster or dedicated nodes to handle increased query and write throughput.
  • Adopt faster or quantized embedding models to reduce latency and cost at scale.
  • Integrate additional delivery channels such as Discord, Slack, SMS, or email directly from n8n.
  • Export logs from Google Sheets to systems like BigQuery, Grafana, or a data warehouse for deeper analytics.

The template provides a strong foundation that can be adapted to different game titles, tournament formats, and organizational requirements without rewriting core logic.

Pre-launch checklist

Before pushing the Esports Match Alert system into production, verify:

  • Webhook is secured with token and signature validation where supported.
  • All API keys and credentials are stored in n8n credentials, not hard coded.
  • The Weaviate index (esports_match_alert or equivalent) is created, populated with test data, and queryable.
  • The embedding provider meets your latency and cost requirements under expected load.
  • Google Sheets logging works end to end with sample events and correct column mappings.
  • LangChain Agent outputs are reviewed for accuracy, tone, and consistency with your brand or broadcast style.

Conclusion

This n8n-based Esports Match Alert pipeline demonstrates how to orchestrate LLMs, vector search, and traditional automation tools into a cohesive system. By combining n8n for workflow automation, Hugging Face for embeddings, Weaviate for semantic storage, and LangChain or OpenAI for reasoning, you can deliver context-rich, real-time alerts with minimal custom code.

The same architecture can be reused for other domains that require timely, context-aware notifications, such as sports analytics, incident management, or customer support. For esports operations, it provides a practical path from raw match events to intelligent, audit-ready communications.

If you would like a starter export of the n8n workflow or a detailed video walkthrough, use the link below.

Get the n8n

Build an Environmental Data Dashboard with n8n

Build an Environmental Data Dashboard with n8n, Weaviate, and OpenAI

Imagine this: your sensors are sending environmental data every few seconds, your inbox is full of CSV exports, and your brain is quietly screaming, “There has to be a better way.” If you have ever copy-pasted readings into spreadsheets, tried to search through old reports, or manually explained the same anomaly to three different stakeholders, this guide is for you.

In this walkthrough, you will learn how to use an n8n workflow template to build a scalable Environmental Data Dashboard that actually works for you, not the other way around. With n8n handling orchestration, OpenAI taking care of embeddings and language tasks, and Weaviate acting as your vector database, you get a searchable, conversational, and memory-enabled dashboard without writing a giant backend service.

The workflow automatically ingests environmental readings, splits and embeds text, stores semantic vectors, finds similar records, and logs everything neatly to Google Sheets. In other words: fewer repetitive tasks, more time to actually interpret what is going on with your air, water, or whatever else you are monitoring.

What this n8n template actually does

At a high level, this Environmental Data Dashboard template turns raw telemetry into something you can search, ask questions about, and audit. It combines no-code automation with AI so you can build a smart dashboard without reinventing the wheel.

Key benefits of this architecture

  • Real-time ingestion via webhooks – sensors, IoT gateways, or scripts send data directly into n8n as it happens.
  • Semantic search with embeddings and Weaviate – instead of keyword matching, you search by meaning using a vector database.
  • Conversational access via an LLM Agent – ask natural language questions and get context-rich answers.
  • Simple logging in Google Sheets – keep a clear audit trail without building a custom logging system.

All of this is stitched together with an n8n workflow that acts as the control center for your Environmental Data Dashboard.

How the n8n workflow is wired together

The template uses a series of n8n nodes that each play a specific role. Instead of one massive block of code, you get a modular pipeline that is easy to understand and tweak.

  1. Webhook – receives incoming POST requests with environmental data.
  2. Splitter – breaks long text payloads into chunks using a character-based splitter.
  3. Embeddings – uses OpenAI to convert each chunk into an embedding vector.
  4. Insert – stores embeddings plus metadata in a Weaviate index named environmental_data_dashboard.
  5. Query and Tool – search the vector store for similar records and expose that capability to the Agent.
  6. Memory – keeps recent conversation context so the Agent can handle follow-up questions.
  7. Chat – an OpenAI chat model that generates human-readable answers.
  8. Agent – orchestrates tools, memory, and chat to decide what to do and how to respond.
  9. Sheet – appends logs and results to a Google Sheet for auditing.

Once set up, the workflow becomes your automated assistant for environmental telemetry: it remembers, searches, explains, and logs, without complaining about repetitive tasks.

Quick-start setup guide

Let us walk through the setup in a practical way so you can go from “idea” to “working dashboard” without getting lost in the details.

1. Capture data with a Webhook

Start with a Webhook node in n8n. Configure it like this:

  • HTTP Method: POST
  • Path: something like /environmental_data_dashboard

This endpoint will receive JSON payloads from your sensors, IoT gateways, or scheduled scripts. Think of it as the front door to your Environmental Data Dashboard.

2. Split incoming text into digestible chunks

Long reports or verbose telemetry logs are great for humans, less great for embedding models if you throw them in all at once. Use the Splitter node to chunk the text with these recommended settings:

chunkSize: 400
chunkOverlap: 40

This character-based splitter keeps semantic units intact while avoiding truncation. In other words, your model does not get overwhelmed, and you do not lose important context.

3. Generate OpenAI embeddings

Connect the Splitter output to an Embeddings node that uses OpenAI. Configure it by:

  • Choosing your preferred embedding model or leaving it as default if you rely on n8n’s abstraction.
  • Setting up your OpenAI API credentials in n8n credentials (never in plain text on the node).

Each chunk is turned into an embedding vector, which is basically a numerical representation of meaning. These vectors are what make semantic search possible.

4. Store vectors in Weaviate

Next, use an Insert node to send those embeddings to Weaviate. Configure it with:

  • indexName: environmental_data_dashboard

Along with each embedding, include useful metadata so your search results are actionable. Common fields include:

  • timestamp
  • sensor_id
  • location
  • pollutant_type or sensor_type
  • raw_text or original payload

This combination of embeddings plus metadata is what turns a vector store into a practical environmental data dashboard.

5. Query the vector store for context

When the Agent needs context or you want to detect anomalies, use the Query node to search Weaviate for similar embeddings. Then connect that to a Tool node so the Agent can call it programmatically.

This lets the system do things like:

  • Find historical events similar to a new spike.
  • Pull related records when a user asks “What caused the air quality drop on July 12?”.

6. Add conversational memory

To keep your Agent from forgetting everything between questions, add a Memory node using a buffer window. This stores recent conversation context.

It is especially useful when users ask follow-up questions such as, “How has PM2.5 trended this week in Zone A?” and expect the system to remember what you were just talking about.

7. Combine Chat model and Agent logic

The Agent node is where the magic orchestration happens. It connects:

  • The Chat node (OpenAI chat model) for natural language reasoning and responses.
  • The Memory node to keep context.
  • The Tool node that queries Weaviate.

Configure the Agent prompt and behavior so it can:

  • Decide when to call the vector store for extra context.
  • Generate clear, human-readable answers.
  • Expose any relevant details for logging to Google Sheets.

8. Log everything to Google Sheets

Finally, use a Sheet node to append logs or results to a Google Sheet. Configure it roughly like this:

  • Operation: append
  • sheetName: Log

Capture fields such as:

  • timestamp
  • query_text
  • agent_response
  • vector_matches
  • raw_payload

This gives you an instant audit trail without having to build a custom logging system. No more mystery decisions from your AI Agent.

Security, credentials, and staying out of trouble

Even though automation is fun, you still want to avoid accidentally exposing data or keys. Keep things safe with a few best practices:

  • Store API keys in n8n credentials, not in node-level plain text.
  • Use HTTPS for webhook endpoints and validate payloads with HMAC or API keys to prevent spoofed submissions.
  • Restrict access to Weaviate using VPC, API keys, or authentication and tag vectors with dataset or tenant identifiers for multi-tenant setups.
  • Apply rate limiting and batching to keep embedding costs under control, especially for high-frequency sensor networks.

Optimization tips for a smoother dashboard

Control embedding costs with batching

Embeddings are powerful but can get pricey if you are embedding every tiny reading individually. To optimize:

  • Buffer events for a short period, such as a minute, and embed in batches.
  • Tune chunkSize and chunkOverlap to reduce the number of chunks while preserving meaning.

Improve search relevance with better metadata

If search results feel a bit vague, enrich your vectors with structured metadata. Useful fields include:

  • location
  • timestamp
  • sensor_type
  • severity

Then, when querying Weaviate, use filtered searches to narrow down results based on these fields instead of scanning everything.

Plan for long-term storage

For long-running projects, you likely do not want to keep every raw reading in your primary vector store. A good pattern is:

  • Store raw data in cold storage such as S3 or Blob storage.
  • Keep summaries or embeddings in Weaviate for fast semantic search.
  • Track the embedding model version in metadata so you can re-generate embeddings if you change models later.

Common ways to use this Environmental Data Dashboard

Once this n8n workflow is live, you can use it for more than just passive monitoring. Some popular use cases include:

  • Search historical reports for similar anomalies when something unusual happens.
  • Ask natural language questions like “What caused the air quality drop on July 12?” and have the Agent respond with context and supporting records.
  • Real-time alerts where new telemetry embeddings that differ from normal clusters trigger Slack or email alerts.

Template configuration reference

Here is a quick reference of the important node parameters used in the template, so you do not have to hunt through each node manually:

  • Webhook: path = environmental_data_dashboard, HTTP method = POST
  • Splitter: chunkSize = 400, chunkOverlap = 40
  • Embeddings: model = default (OpenAI API credentials configured in n8n)
  • Insert / Query: indexName = environmental_data_dashboard in Weaviate
  • Sheet: Operation = append, sheetName = Log

Example webhook payload

To test your webhook or integrate a sensor, you can send a JSON payload like this:

{  "sensor_id": "zone-a-01",  "timestamp": "2025-08-01T12:34:56Z",  "location": "Zone A",  "type": "PM2.5",  "value": 78.4,  "notes": "Higher than usual, wind from north"
}

This kind of payload will flow through the entire pipeline: webhook, splitter, embeddings, Weaviate, Agent, and logging.

Where to go from here

With this Environmental Data Dashboard template, you get a ready-made foundation to capture, semantically index, and interact with environmental telemetry. No more manually scanning spreadsheets or digging through logs by hand.

From here you can:

  • Add alerting channels like Slack or SMS for real-time notifications.
  • Build a UI that queries the Agent or vector store to generate charts and trend summaries.
  • Integrate additional tools, such as time-series databases, for deeper analytics.

To get started, import the n8n workflow template, plug in your OpenAI and Weaviate credentials, and point your sensors at the webhook path. In just a few minutes, you can have a searchable, conversational Environmental Data Dashboard running.

Call to action: Try the template, fork it for your specific use case, and share your feedback. If you need help adapting the pipeline for high-frequency IoT data or complex deployments, reach out to our team for consulting or a custom integration.

Battery Health Monitor with n8n & LangChain

Battery Health Monitor with n8n & LangChain: Turn Raw Telemetry into Action

Imagine never having to manually sift through battery logs again, and instead having a smart, automated system that watches your fleet, learns from history, and surfaces the right insights at the right time. That is exactly what this n8n workflow template helps you build.

In this guide you will walk through a practical journey: starting from the challenge of messy battery telemetry, shifting into what is possible with automation, then implementing a concrete n8n workflow that uses LangChain components, Hugging Face embeddings, a Redis vector store, and Google Sheets logging. By the end, you will have a reusable Battery Health Monitor that not only saves time, but becomes a building block for a more automated, focused way of working.

The problem: Telemetry without insight

Battery-powered devices constantly generate data: voltage, temperature, cycles, warnings, and long diagnostic notes. On its own, this telemetry is noisy and difficult to interpret. You might:

  • Scroll through endless logs looking for patterns.
  • Miss early warning signs of degradation or overheating.
  • Spend hours manually correlating current issues with past incidents.

This manual approach does not scale. It slows you down, eats into time you could spend improving your product, and makes it harder to respond quickly when something goes wrong.

The mindset shift: From manual checks to automated intelligence

Instead of reacting to issues one by one, you can design a system that observes, remembers, and recommends. With n8n and modern AI tooling, you can:

  • Turn incoming battery telemetry into structured, searchable knowledge.
  • Automatically compare new events against historical patterns.
  • Use an AI agent to suggest actions and log decisions for future audits.

This is not about replacing your expertise. It is about multiplying it. When you let automation handle repetitive analysis, you free yourself to focus on strategy, product quality, and scaling your operations.

The architecture: Building blocks for a smarter battery monitor

The Battery Health Monitor workflow combines a set of powerful components that work together as a cohesive system:

  • n8n for low-code orchestration, routing, and Webhook endpoints.
  • Text splitter & embeddings to convert long diagnostic notes into compact vector embeddings.
  • Redis vector store as a fast, persistent similarity search index.
  • Memory + Agent for contextual reasoning over current and past telemetry.
  • Google Sheets for a simple, auditable log of alerts and recommendations.

Each piece is modular and replaceable, so you can start simple and evolve the workflow as your fleet grows or your needs change.

How the n8n workflow works end-to-end

At a high level, the workflow follows this flow inside n8n:

  1. A Webhook receives POST telemetry from your devices.
  2. A Text Splitter breaks long notes or logs into overlapping chunks.
  3. An Embeddings node (Hugging Face) converts each chunk into a numeric vector.
  4. An Insert node stores those vectors in a Redis index named battery_health_monitor.
  5. A Query node searches Redis for similar historical events.
  6. A Tool node exposes this vector search as a tool to the Agent.
  7. A Memory node keeps recent context for the Agent.
  8. A Chat (LM) node and Agent use memory and tools to produce recommendations.
  9. A Google Sheets node appends all key details into a sheet for tracking and auditing.

What you get is a loop that continuously learns from your data, references the past, and records its own decisions. It is a small but powerful step toward an automated observability layer for your batteries.

Step-by-step: Build your Battery Health Monitor in n8n

Now let us turn this architecture into a working n8n workflow. Follow the steps below, then iterate and improve once you have it running.

1. Create the Webhook endpoint

Start by creating the entry point for your telemetry.

  • Add a Webhook node in n8n.
  • Set the HTTP method to POST.
  • Set the path to /battery_health_monitor.

This Webhook will receive JSON payloads containing battery metrics such as voltage, temperature, cycle count, and health flags. It becomes the front door for all your battery data.

2. Split long notes with a Text Splitter

Diagnostic notes and logs can be long and unstructured. Before embedding them, you want to break them into manageable pieces while preserving context.

  • Attach a Text Splitter node to the Webhook.
  • Use character-based splitting.
  • Configure:
    • chunkSize: 400
    • chunkOverlap: 40

This configuration helps the embedding model handle longer messages while still keeping enough overlap so that important context is not lost between chunks.

3. Generate embeddings with Hugging Face

Next, you convert each text chunk into a vector so you can perform similarity search later.

  • Add an Embeddings node in n8n.
  • Select the Hugging Face provider and enter your API credentials.
  • Choose an embedding model compatible with your account and set the model parameter accordingly.

The node transforms each chunk into a numeric vector representation that captures semantic meaning. These vectors are the foundation for finding similar historical events.

4. Store vectors in a Redis vector index

Now you need a fast, persistent place to store and query your embeddings.

  • Add a Redis vector store node.
  • Configure your Redis connection (host, port, authentication).
  • Set the mode to insert.
  • Use an index name such as battery_health_monitor.

Once configured, each new telemetry event will contribute its embeddings to the Redis index, gradually building a searchable knowledge base of your battery history.

5. Query the vector store for similar patterns

To make your agent context aware, you need to retrieve relevant historical chunks when new telemetry arrives.

  • Add a Query node connected to the Redis vector store.
  • Configure it to perform similarity searches against the battery_health_monitor index.

During workflow execution, this node returns the most relevant chunks for the current telemetry, such as similar failures, temperature spikes, or lifetime patterns. These results become evidence the Agent can reference when making recommendations.

6. Combine Agent, Memory, Tool, and Chat

This is where your workflow becomes more than a data pipeline. It becomes an intelligent assistant for your battery fleet.

  • Tool node – Wrap the Redis similarity query as a tool that the Agent can call when it needs historical context.
  • Memory node – Add a memory buffer to store recent interactions and outputs. Configure the memory window so the Agent can recall the latest context without being overwhelmed.
  • Chat (LM) node – Use a Hugging Face-hosted language model to generate human readable insights and recommendations.
  • Agent node – Connect the model, memory, and tool. The Agent orchestrates when to query Redis, how to interpret the results, and what to output, such as alerts, root cause hints, or structured data for logging.

With clear prompts and the right tools, the Agent can say things like: “This looks similar to previous voltage sag incidents on devices with high cycle counts. Recommended action: schedule preventive maintenance.”

7. Log everything in Google Sheets

To make your system auditable and easy to review, you can log each decision in a simple spreadsheet.

  • Add a Google Sheets node.
  • Configure it to append rows to a sheet named Log.
  • Map fields from the Agent output, including:
    • Device ID
    • Timestamp
    • Health score or state of health
    • Recommended action or alert level
    • Context links or references to similar historical events

Over time this sheet becomes a structured history of your fleet health, decisions, and outcomes, which is invaluable for audits, tuning, and continuous improvement.

Example telemetry payload

Here is a sample JSON payload you can use to test your Webhook and workflow:

{  "device_id": "BAT-1001",  "timestamp": "2025-08-31T12:34:56Z",  "voltage": 3.7,  "temperature": 42.1,  "cycle_count": 450,  "state_of_health": 78,  "notes": "Voltage sag observed during peak draw. Temperature spikes when charging."
}

Send a payload like this to your /battery_health_monitor endpoint and watch how the workflow ingests, stores, analyzes, and logs the event.

Best practices to get real value from this template

Once your Battery Health Monitor is running, the next step is tuning. Small adjustments can significantly improve the quality of your insights and the reliability of your automation.

Choosing the right embedding model

Select an embedding model that balances cost and quality. For technical telemetry and diagnostic text, models trained on technical or domain specific language often yield better similarity results. Experiment with a couple of options and compare how well they cluster similar incidents.

Optimizing chunk size and overlap

The Text Splitter configuration has a direct impact on embedding quality.

  • If chunks are too small, you lose context and the model may miss important relationships.
  • If chunks are too large, you might hit model limits or reduce similarity precision.

Use the default chunkSize: 400 and chunkOverlap: 40 as a starting point, then adjust based on your average log length and the richness of your notes.

Configuring Redis for accurate search

Redis is the engine behind your similarity search, so it needs to be aligned with your embeddings.

  • Ensure the index dimension matches the embedding vector size.
  • Choose an appropriate distance metric (for example cosine) based on the embedding model.
  • Store metadata such as device_id and timestamp so you can filter queries by device, time range, or other attributes.

With good indexing, your Agent will retrieve more relevant context and make more confident recommendations.

Designing safe and effective Agent prompts

The Agent is powerful, but it needs clear boundaries.

  • Use system level instructions that define the Agent’s role, such as “act as a battery health analyst.”
  • Ask it to only make strong recommendations when the retrieved evidence is sufficient.
  • Require it to reference similar historical cases from the vector store whenever possible.

This reduces hallucinations and keeps your outputs grounded in actual data.

Security and scalability as you grow

As your workflow becomes more central to operations, it is important to treat it like production infrastructure.

  • Protect your Webhook with API keys or signature verification.
  • Use HTTPS for secure transport and, where possible, request signing.
  • Run Redis in a managed, private network with encryption in transit.
  • Limit access to language models and monitor usage for cost control.
  • Scale out n8n workers and add rate limiting as your device fleet grows.

These steps help ensure your automated battery monitoring remains reliable and secure as you lean on it more heavily.

Turn insights into action with alerts and monitoring

Once your workflow is making recommendations, the next step is to act on them automatically when needed.

  • Trigger emails or push notifications via n8n’s email, Slack, or push nodes when the Agent flags critical conditions, such as thermal runaway risk or sudden health drops.
  • Append high priority events to a dedicated Google Sheet or database table for escalation.
  • Send metrics to Prometheus or Datadog to track trends and performance over time.

This transforms your Battery Health Monitor from a passive reporting tool into an active guardian for your fleet.

Where this template fits: Real-world use cases

This n8n workflow template is flexible enough to support many scenarios, including:

  • Monitoring battery health for EVs, scooters, or drone fleets.
  • Tracking industrial UPS and backup power systems for early warning signals.
  • Managing consumer device fleets for warranty analysis and predictive maintenance.

Use it as a starting point, then adapt it to the specific metrics, thresholds, and business rules that matter to you.

Troubleshooting and continuous improvement

As with any automation, you will learn the most by running it in the real world and iterating. Here are common issues and how to address them:

  • Empty or poor search results: Check that your embedding model is compatible with the Redis index configuration and that the index dimensions match the vector size.
  • Vague or unhelpful Agent responses: Tighten the Agent prompt, provide clearer instructions, improve memory configuration, and ensure the Tool node returns enough evidence.
  • Redis insertion errors: Verify credentials, network connectivity, and that the index exists or is created with the correct settings.

Each fix moves you toward a more reliable and powerful monitoring system.

Your next step: Use this template as a launchpad

This Battery Health Monitor pattern gives you a practical, scalable way to add context aware analysis and automated decision logging using n8n, LangChain primitives, Redis, and Hugging Face embeddings. It is fast to deploy, easy to audit via Google Sheets, and designed to be extended with more tools, alerts, and integrations as your needs grow.

Most importantly, it is a stepping stone. Once you see how this workflow transforms raw telemetry into useful action, you will start to notice other processes you can automate and improve with n8n.

Take action now:

  • Deploy the n8n workflow template.
  • Plug in your Hugging Face, Redis, and Google Sheets credentials.
  • Send a sample payload to /battery_health_monitor within the next 30 minutes.

Use that first run as a learning moment. Tweak the text splitter, try a different embedding model, or refine the Agent prompt. Each small improvement moves you closer to a robust, AI powered monitoring system that works for you around the clock.

Energy Consumption Anomaly Detector with n8n

Energy Consumption Anomaly Detector with n8n: Turn Your Data Into Insight

Every unexpected spike in energy usage, every quiet dip in consumption, is a story waiting to be told. For utilities, facility managers, and IoT operators, those stories are often buried in endless time-series data and noisy dashboards.

If you have ever felt overwhelmed by manual monitoring, rigid rules, and false alarms, you are not alone. The good news is that you can turn this chaos into clarity with automation that actually understands your data.

This guide walks you through an n8n workflow template that uses Hugging Face embeddings and Supabase vector storage to detect anomalies in energy consumption. More than just a technical setup, it is a stepping stone toward a more automated, focused, and proactive way of working.

From Manual Monitoring To Intelligent Automation

Traditional rule-based systems often feel like a game of whack-a-mole. You set thresholds, tweak rules, and still miss subtle issues or drown in false positives. As your infrastructure grows, this approach becomes harder to maintain and even harder to trust.

Instead of asking you to manually define every possible pattern, vector embeddings and semantic similarity let your system learn what “normal” looks like and spot what does not fit. It is a shift in mindset:

  • From rigid rules to flexible patterns
  • From endless tuning to data-driven thresholds
  • From reactive firefighting to proactive detection

With n8n as your automation layer, you can orchestrate this entire flow, connect it to your existing tools, and keep improving it as your needs evolve.

Why Vector Embeddings Are Powerful For Anomaly Detection

Energy data is often time-series based, noisy, and full of seasonal or contextual patterns. Trying to capture all of that with static rules is exhausting. Embeddings offer a more natural way to represent this complexity.

By converting consumption windows into vectors, you can:

  • Compare new data to historical patterns with fast similarity search
  • Detect unusual behavior that does not match past usage, even if it is subtle
  • Adapt your detection logic without rewriting dozens of rules

In this workflow, you store historical consumption chunks as embeddings in a Supabase vector store. Each new window of readings is transformed into a vector, then compared to its nearest neighbors. When similarity drops or patterns shift, you can flag anomalies, log them, and trigger actions automatically.

Mindset Shift: Think In Windows, Not Individual Points

Instead of inspecting single readings, this n8n template encourages you to think in terms of “windows” of time. Each window captures a slice of behavior, such as 60 minutes of power usage, and turns it into a semantically rich representation.

This mindset unlocks:

  • Context-aware detection, where patterns across time matter more than isolated values
  • Smoother anomaly scores, less noise, and more meaningful alerts
  • A scalable path to add more features, such as seasonal comparison or multi-device analysis

You are not just setting up a one-off workflow. You are building a foundation you can extend as your automation strategy grows.

The Architecture: Your Automation Stack At A Glance

The Energy Consumption Anomaly Detector n8n template brings together several components into a cohesive, production-ready pipeline:

  • Webhook – Receives incoming energy consumption payloads from meters, gateways, or batch jobs.
  • Splitter – Breaks long inputs (CSV or JSON time-series) into overlapping windows for embedding.
  • Hugging Face Embeddings – Converts each window into a vector representation.
  • Supabase Vector Store – Stores vectors along with metadata such as timestamps and device IDs.
  • Query / Tool Node – Finds nearest neighbors and provides data for anomaly scoring.
  • Memory & Agent – Adds context, generates human-readable explanations, and automates decisions.
  • Google Sheets – Optionally logs anomalies and decisions for review, auditing, or retraining.

Each piece is modular, so you can start simple and then refine, expand, or swap components as your system matures.

How A Single Payload Flows Through The Workflow

Picture a new batch of readings arriving from one of your meters. Here is how the n8n template processes it, step by step, turning raw numbers into actionable insight.

  1. Receive data via Webhook
    The Webhook node accepts POST requests that include:
    • device_id
    • Timestamped readings
    • Optional metadata such as location
  2. Chunk readings into windows
    The Splitter node creates rolling windows from your time-series. In the template:
    • chunkSize = 400
    • chunkOverlap = 40

    This overlap preserves continuity and helps the embeddings capture transitions smoothly.

  3. Generate embeddings with Hugging Face
    Each chunk is passed to the Hugging Face Embeddings node, which converts the window into a vector. This vector encodes the shape and behavior of the consumption pattern, not just raw numbers.
  4. Insert vectors into Supabase
    The embeddings, along with metadata, are stored in the Supabase vector index:
    • indexName = energy_consumption_anomaly_detector

    Over time, this builds a rich historical representation of how each device behaves.

  5. Query neighbors and detect anomalies
    When new data arrives, the workflow:
    • Queries nearest neighbors from the vector store
    • Feeds results into the Agent node
    • Applies anomaly logic and logs outcomes, for example in Google Sheets or another sink

The result is a loop that learns from your historical data and continuously evaluates new behavior, all orchestrated through n8n.

Smart Strategies For Anomaly Detection With Vectors

Once your data is represented as vectors, you can combine several strategies to build robust anomaly scores. This is where your creativity and domain knowledge really matter.

  • Nearest neighbor distance
    Measure how far a new window is from its k-nearest historical neighbors. If the average distance exceeds a threshold, flag it as an anomaly.
  • Local density
    Look at how densely the vector space is populated around the new point. Sparse regions often indicate unfamiliar patterns.
  • Temporal drift
    Compare the new window not only to recent data, but also to past windows from the same hour or day. This helps reveal seasonal or schedule-related deviations.
  • Hybrid ML scoring
    Combine vector-based distance with a simple model such as an isolation forest or autoencoder on numeric features. This can strengthen your detection pipeline.

Recommended Anomaly Scoring Formula

A practical starting point for an anomaly score S is:

S = alpha * normalized_distance + beta * (1 - local_density) + gamma * temporal_deviation

You can tune alpha, beta, and gamma on a validation set, ideally using historical labeled anomalies. This tuning phase is where your workflow evolves from “working” to “highly effective.”

What To Store: Data And Metadata That Unlock Insight

The quality of your anomaly detection is tightly linked to what you store alongside each embedding. In Supabase, include metadata that makes filtering and interpretation easy and fast.

Recommended fields:

  • device_id or meter_id for identifying the source
  • start_timestamp and end_timestamp for each chunk
  • Summary statistics such as mean, median, min, max, variance
  • Raw chunk hash or link to retrieve full series when needed
  • Label (optional) for supervised evaluation or manual tagging

These details make it easier to slice data by device, time window, or conditions and to debug or refine your detection logic.

Example Webhook Payload

Here is a sample payload your Webhook node might receive:

{  "device_id": "meter-01",  "readings": [  {"ts":"2025-08-31T09:00:00Z","value":12.4},  {"ts":"2025-08-31T09:01:00Z","value":12.7},  ...  ],  "metadata": {"location":"Building A"}
}

You can adapt the schema to your environment, but keep the essentials: device identifier, timestamped readings, and optional metadata.

Configuring Your n8n Nodes For Success

The template gives you a solid starting point, and a few configuration choices will help you tailor it to your environment and scale.

  • Webhook
    Set a clear path, for example energy_consumption_anomaly_detector, and secure it with a secret token in headers.
  • Splitter
    Align chunkSize and chunkOverlap with your data cadence. The default 400 points with 40 overlap works well for dense streams, but you can adjust based on your sampling rate.
  • Embeddings (Hugging Face)
    Choose a model suitable for numerical sequences or short time-series. Store your API credentials in the n8n credentials manager to keep everything secure and reusable.
  • Supabase Vector Store Insert
    Use the index name energy_consumption_anomaly_detector and include metadata fields. This enables filtered similarity search by device, time window, or other attributes.
  • Query Node
    Start with k = 10 nearest neighbors. Compute distances and feed them into your anomaly score calculation.
  • Agent Node
    Use the agent to:
    • Generate human-friendly explanations of each anomaly
    • Decide whether to notify operations or escalate
    • Append logs or comments for future analysis
  • Logging (Google Sheets or similar)
    Log anomalies, scores, decisions, and context. This creates a valuable dataset for retraining, threshold tuning, and audits.

Evaluating And Improving Your Detector Over Time

Automation is not a one-time project. It is a continuous journey. To keep improving your anomaly detector, monitor both detection quality and operational performance.

Key metrics to track:

  • True positive rate (TPR) and false positive rate (FPR) on labeled incidents
  • Time-to-detect – how long it takes from event occurrence to anomaly flag
  • Operational metrics such as:
    • API request latencies
    • Vector store query times
    • Embedding costs for Hugging Face models

Run periodic backtests by replaying historical windows through the workflow. Use maintenance logs and incident reports as ground truth to tune your alpha, beta, and gamma coefficients in the scoring formula.

Security, Privacy, And Cost: Building Responsibly

As you scale automation, staying mindful of security and cost is essential. This template is designed with those concerns in mind, and you can extend it with your own policies.

  • Security & privacy
    • Encrypt personally identifiable information (PII)
    • Restrict access to the Supabase database
    • Store only aggregated summaries in the vector store if raw data is sensitive
  • Cost management
    • Rate-limit webhook and embedding calls to control external API costs
    • Monitor usage and set budgets for vector storage and model calls

With these safeguards in place, you can scale confidently without surprises.

Scaling Your Workflow To Production

Once the template is running smoothly on a small subset of devices, you can gradually scale it to cover more sources and higher volumes.

  • Batch embeddings for multiple chunks to reduce API overhead and improve throughput.
  • Shard vector stores by region or device class to lower latency and simplify scaling.
  • Use asynchronous alert channels such as queues or pub/sub when many anomalies may trigger at once.
  • Persist raw time-series in a dedicated time-series database (InfluxDB, TimescaleDB) while keeping the vector store lean and focused on embeddings.

This approach lets you grow from a proof-of-concept to a production-grade anomaly detection system without rewriting your entire stack.

A Real-World Example: From Anomaly To Action

Imagine a manufacturing plant streaming minute-level power readings from a key device. A 60-minute window is created, chunked, and embedded using the workflow.

The new window’s vector is compared against its ten nearest historical neighbors. The average distance turns out to be three times the historical mean distance for that device and hour. The Agent node recognizes this as unusual, marks the window as anomalous, and writes a detailed entry to Google Sheets.

The log includes:

  • device_id
  • Relevant timestamps
  • Anomaly score and contributing factors
  • Suggested next steps, such as inspecting HVAC or checking recent maintenance

The operations team receives an alert, investigates, and resolves the root cause faster than they could have with manual monitoring alone. Over time, these small wins compound into significant savings and more reliable operations.

Taking The Next Step: Make This Template Your Own

This n8n workflow is more than a template. It is a starting point for a more automated, insight-driven way of managing energy consumption. You can begin with the default configuration, then iterate as you learn from your data.

To get started:

  • Import the Energy Consumption Anomaly Detector template into your n8n instance.
  • Configure your Hugging Face and Supabase credentials in the n8n credentials manager.
  • Adjust chunkSize, thresholds, and neighbor counts to match your data cadence and noise level.

As you gain confidence, experiment with new scoring strategies, additional metadata, or different notification channels. Each adjustment is a step toward an automation system that reflects your unique environment and goals.

If you need help tailoring the pipeline to your setup, you can reach out for implementation support or request a walkthrough. You do not have to build everything alone.

Ready to deploy? Export the workflow, plug in your credentials, and run a few historical replays. Validate the detector, refine your thresholds, and when you are comfortable, route alerts to your operations team.

Edge Device Log Compressor with n8n

Edge Device Log Compressor with n8n: A Step-by-Step Teaching Guide

What You Will Learn

In this guide, you will learn how to use an n8n workflow template to:

  • Ingest logs from edge devices securely using a Webhook
  • Split large log payloads into smaller, meaningful text chunks
  • Convert those chunks into vector embeddings for semantic search
  • Store embeddings and metadata in a Redis vector database
  • Query logs using an AI agent that uses memory and tools
  • Summarize or compress logs and save the results into Google Sheets
  • Apply best practices around configuration, security, and cost

This is the same core architecture as the original template, but explained in a more instructional, step-by-step way so you can understand and adapt it for your own edge device environment.

Why Compress Edge Device Logs?

Edge devices generate continuous streams of data: telemetry, error traces, health checks, and application-specific events. Keeping all raw logs in a central system is often:

  • Expensive to store and back up
  • Slow to search and filter in real time
  • Hard to interpret because of noise and repetition

The n8n Edge Device Log Compressor template focuses on semantic compression rather than simple file compression. Instead of just shrinking file sizes, it turns verbose logs into compact, meaningful representations that are easier to search, summarize, and analyze.

Key benefits of compressing logs in this way include:

  • Lower storage and transfer costs by storing compressed summaries and embeddings instead of full raw logs everywhere
  • Faster incident triage using semantic search to find relevant events by meaning, not just keywords
  • Automated summarization and anomaly detection with an AI agent that can read and interpret log context
  • Better indexing for long-term analytics by keeping structured metadata and embeddings for trend analysis

Conceptual Overview: How the n8n Architecture Works

The template implements a full pipeline inside n8n. At a high level, the workflow:

  1. Receives logs from edge devices via a secured Webhook
  2. Splits large log payloads into overlapping chunks
  3. Creates vector embeddings for each chunk using an embeddings model such as Cohere
  4. Stores embeddings and metadata in a Redis vector store
  5. Lets a user or system send a query that performs vector search on those embeddings
  6. Uses an AI agent with memory and tools to summarize or act on the retrieved logs
  7. Appends the final summarized output to Google Sheets for review or auditing

Core Components of the Workflow

Each component in the n8n template plays a specific role:

  • Webhook – Entry point that receives HTTP POST requests from edge devices.
  • Splitter – Splits large log text into smaller chunks using configurable chunk size and overlap.
  • Embeddings (Cohere or similar) – Turns each text chunk into a vector embedding that captures semantic meaning.
  • Insert (Redis Vector Store) – Stores the embeddings and metadata in a Redis index for fast similarity search.
  • Query + Tool – Performs vector search against Redis and exposes the results as a tool to the AI agent.
  • Memory + Chat (Anthropic or other LLM) – Maintains context across multiple queries and responses.
  • Agent – Orchestrates the LLM, tools, and memory to answer questions, summarize logs, or recommend actions.
  • Google Sheets – Final destination for human-readable summaries, severity ratings, and references to raw logs.

Understanding the Data Flow Step by Step

Let us walk through the full lifecycle of a log entry in this n8n workflow, from ingestion to summarized output.

Step 1 – Edge Device Sends Logs to the Webhook

Edge devices send their logs to an HTTP endpoint exposed by the n8n Webhook node. The endpoint usually accepts JSON payloads and should be protected with secure transport and authentication.

Security options for the Webhook:

  • Use HTTPS to encrypt data in transit
  • Require an API key in headers or query parameters
  • Optionally use mutual TLS (mTLS) for stronger authentication

Example Incoming Payload

An example POST request to /webhook might look like this:

{  "device_id": "edge-123",  "timestamp": "2025-08-31T12:00:00Z",  "logs": "Error: sensor timeout\nReading: 123\n..."
}

Step 2 – Splitter Node Breaks Logs into Chunks

Raw log payloads can be quite large. To make them manageable for embeddings and vector search, the Splitter node divides the log text into smaller, overlapping segments.

The key settings are:

  • chunkSize – The maximum length of each chunk in characters.
  • chunkOverlap – The number of characters that overlap between consecutive chunks.

For example, you might start with:

  • chunkSize: 300 to 600 characters (shorter if logs are noisy or very repetitive)
  • chunkOverlap: 10 to 50 characters to keep context between chunks

This overlapping strategy ensures that important details at chunk boundaries are not lost. In the example payload above, the Splitter might create 3 to 5 overlapping chunks from the original log string.

Step 3 – Embeddings Node Converts Chunks to Vectors

Once the logs are split, each chunk is sent to an Embeddings node. This node calls an embeddings provider such as Cohere to convert each text chunk into a fixed-length numeric vector.

These vectors encode the semantic meaning of the text, which makes it possible to search by similarity rather than by exact keyword match.

When configuring embeddings, consider:

  • Model choice – Cohere is a solid default, but OpenAI and other providers are also options.
  • Dimensionality – Higher dimensional embeddings can capture more nuance but require more storage and compute.

Step 4 – Redis Vector Store Persists Vectors and Metadata

The resulting embeddings are then stored in a Redis vector store. This is typically implemented using Redis modules such as Redisearch or Redis Vector Similarity.

For each chunk, the workflow stores:

  • The embedding vector
  • Metadata such as:
    • device ID
    • timestamp
    • severity (if available)
    • a reference or link to the original raw log

Configuration tips for Redis:

  • Use a Redis cluster or managed Redis with Redisearch for better performance and reliability.
  • Store rich metadata so you can filter queries by device, time range, or severity.
  • Plan for retention and archiving by compacting old vectors or moving them to cold storage when they are no longer queried frequently.

Step 5 – Query and Tool Nodes Perform Semantic Search

Later, when you or a monitoring system needs to investigate an issue, you send a query into the workflow. The Query node performs a similarity search on the Redis vector store to find the most relevant log chunks.

The Tool wrapper then exposes this vector search capability to the AI agent. In practice, this means the agent can:

  • Call the tool with a natural language question
  • Receive back the top matching log chunks and metadata
  • Use those results as context for reasoning and summarization

Example Query

For the earlier payload, a user might ask:

Why did edge-123 report sensor timeout last week?

The Query node will retrieve the most relevant chunks related to edge-123 and sensor timeouts around the requested time window.

Step 6 – AI Agent Uses Memory and Tools to Summarize or Act

Once the relevant chunks are retrieved, an Agent node orchestrates the AI model, tools, and memory.

In this template, the agent typically uses an LLM such as Anthropic via a Chat node, plus a memory buffer that keeps track of recent messages and context. The agent can then:

  • Summarize the root cause of an incident
  • Highlight key errors, patterns, or anomalies
  • Suggest remediation steps or link to runbooks

Memory configuration tips:

  • Use a windowed memory buffer so only the most recent context is kept.
  • Limit memory size to control API costs and keep responses focused.

Step 7 – Google Sheets Stores Summaries and Audit Data

Finally, the workflow writes the agent’s output to a Google Sheets spreadsheet. Each row might include:

  • A human-readable summary of the log events
  • A severity level or classification
  • The device ID and timestamp
  • A link or reference back to the raw log or observability system

This makes it easy for SRE teams, auditors, or analysts to review incidents without digging through raw logs.

Configuring Key Parts of the Template

Configuring the Splitter Node

The Splitter is one of the most important nodes for balancing performance, cost, and quality of results.

  • chunkSize:
    • Start with 300 to 600 characters.
    • Use smaller chunks for very noisy logs so each chunk captures a clearer event.
  • chunkOverlap:
    • Use 10 to 50 characters of overlap.
    • More overlap preserves context across chunks but increases the number of embeddings you store.

Choosing and Tuning Embeddings

For embeddings, you can use Cohere or an alternative provider. When choosing a model:

  • Balance cost against semantic quality.
  • Check the embedding dimensionality and make sure your Redis index is sized appropriately.
  • Consider batching multiple chunks into a single embedding request to reduce API overhead.

Optimizing the Redis Vector Store

To keep Redis efficient and scalable:

  • Use a clustered or managed Redis deployment with Redisearch support.
  • Store metadata fields like:
    • device_id
    • timestamp
    • severity
  • Implement retention policies for old vectors, such as:
    • Archiving older embeddings to object storage
    • Deleting or compacting low-value historical data

Agent, Memory, and Cost Control

The AI agent is powerful but can be expensive if not tuned correctly. To manage this:

  • Keep the memory window small and relevant to the current analysis.
  • Use concise prompts that focus on specific questions or tasks.
  • Limit the number of tool calls per query where possible.

Security and Compliance Best Practices

Since logs may contain sensitive information, treat them carefully throughout the pipeline.

  • Secure the Webhook
    • Always use HTTPS.
    • Protect the endpoint with API keys or mTLS.
  • Encrypt data at rest
    • Encrypt sensitive metadata in Redis.
    • Encrypt Google Sheets or restrict access using proper IAM controls.
  • Sanitize logs for PII
    • Remove or mask personally identifiable information before creating embeddings if required by policy.
  • Retention policies
    • Limit how long you keep raw logs.
    • Store compressed summaries and embeddings for longer-term analysis instead.

Use Cases and Practical Benefits

This n8n template is useful in several real-world scenarios:

  • Real-time incident triage
    • Engineers can query semantic logs to quickly identify root causes.
  • Long-term analytics
    • Compressed summaries and metadata can be analyzed to detect trends and recurring issues.
  • Automated alert enrichment
    • The AI agent can enrich alerts with contextual summaries and recommended runbooks.

Monitoring, Scaling, and Cost Management

To keep your deployment efficient and cost effective, monitor:

  • Embedding request volume
    • This is often a primary cost driver.
    • Use batching where possible to reduce per-request overhead.
  • Redis storage usage
    • Track how many vectors you store and how quickly the dataset grows.
    • Shard or archive old vectors to cheaper storage if you need long-term semantic search.

Hands-On: Getting Started with the Template

To try the Edge Device Log Compressor workflow in your own environment, follow these practical steps:

  1. Clone the n8n workflow template
    • Use the provided template link to import the workflow into your n8n instance.
  2. Configure credentials
    • Set up API keys and connections for:
      • Cohere (or your embeddings provider)
      • Redis (vector store)
      • Anthropic or your chosen LLM
      • Google Sheets
  3. Test with sample edge payloads
    • Send sample JSON logs from your edge devices or test tools.
    • Tune chunkSize and chunkOverlap based on log structure and performance.
  4. Set up retention, alerting, and access control
    • Define how long you keep raw logs and embeddings.
    • Configure alerts for high error rates or anomalies.
    • Ensure only authorized users can access logs and summaries.

Automating Drone Crop Health with n8n & LangChain

Automating Drone Image Crop Health With n8n & LangChain

Modern precision agriculture increasingly relies on automated AI pipelines to transform drone imagery into operational decisions. This article presents a production-grade workflow template built on n8n that coordinates drone image ingestion, text processing with LangChain, OpenAI embeddings, Supabase as a vector database, an Anthropic-powered agent, and Google Sheets for logging and reporting.

The goal is to provide automation engineers and agritech practitioners with a robust reference architecture that is modular, scalable, and explainable, while remaining practical to deploy in real-world environments.

Business case: Why automate drone-based crop health analysis?

Manual inspection of drone imagery is labor intensive, difficult to scale, and prone to inconsistent assessments between agronomists. An automated workflow offers several advantages:

  • Faster detection of crop stress, disease, or nutrient deficiencies
  • Standardized, repeatable evaluation criteria across fields and teams
  • Reduced manual data handling so agronomists can focus on interventions
  • Traceable recommendations with clear context and audit logs

The n8n workflow template described here is designed to support these objectives by combining vector search, LLM-based reasoning, and structured logging into a single, orchestrated pipeline.

Pipeline architecture and data flow

The end-to-end architecture can be summarized as:

Webhook → Text Splitter → OpenAI Embeddings → Supabase Vector Store → LangChain Agent (Anthropic) → Google Sheets

At a high level, the pipeline executes the following steps:

  • A drone system or upstream ingestion service sends image metadata and analysis notes to an n8n Webhook.
  • Relevant text (captions, OCR results, or metadata) is segmented into chunks optimized for embedding.
  • Each chunk is converted into a vector representation using OpenAI embeddings.
  • Vectors, along with associated metadata, are stored in a Supabase vector index for retrieval.
  • When an agronomist or downstream system submits a query, the workflow retrieves the most similar records from Supabase.
  • An Anthropic-based LangChain agent uses these retrieved contexts to generate structured recommendations.
  • The agent’s outputs are appended to Google Sheets for monitoring, reporting, and integration with other tools.

This design separates ingestion, indexing, retrieval, and reasoning into clear stages, which simplifies debugging and makes it easier to scale or swap components over time.

Core n8n components and integrations

Webhook: Entry point for drone imagery events

The workflow begins with an n8n Webhook node that exposes a POST endpoint. Drone platforms or intermediate services submit JSON payloads containing image details and any preliminary analysis. A typical payload might look like:

{  "image_url": "https://s3.example.com/drone/field123/image_2025-08-01.jpg",  "coords": {"lat": 40.12, "lon": -88.23},  "timestamp": "2025-08-01T10:12:00Z",  "notes": "NDVI low in northeast quadrant"
}

Fields such as image_url, coordinates, timestamp, and NDVI-related notes are preserved as metadata and passed downstream through the workflow.

Text Splitter: Preparing content for embeddings

Before generating embeddings, the workflow uses a text splitter node to partition long descriptions, OCR output, or combined metadata into manageable segments.

In the template, the splitter is configured with:

  • chunkSize = 400
  • chunkOverlap = 40

These defaults work well for short to medium-length metadata and notes. For deployments with very long OCR transcripts (for example, more than 2000 characters), you can reduce chunkOverlap to control token usage, while ensuring that each chunk still contains enough context for the model to interpret correctly.

OpenAI Embeddings: Vectorizing agronomic context

The Embeddings node uses OpenAI to convert text chunks into dense vector embeddings. The template assumes an OpenAI embeddings model such as text-embedding-3-large, authenticated via your OpenAI API key.

Recommended practices when configuring this node:

  • Batch multiple chunks in a single call where possible to improve throughput for high-volume ingestion.
  • Attach metadata such as image_url, coords, timestamp, and NDVI-related attributes to each vector record.
  • Monitor embedding usage and costs, especially for large drone fleets or frequent flights.

By persisting rich metadata with each vector, you enable more powerful downstream filtering, mapping, and analysis.

Supabase Vector Store: Persistent similarity search

Supabase, backed by Postgres with vector extensions, serves as the vector store for this workflow. The n8n template uses two primary operations:

  • Insert: Store newly generated vectors with an index name such as drone_image_crop_health.
  • Query: Retrieve the top-K nearest neighbors for a given query embedding.

When inserting vectors, configure the table or index to include fields like:

  • image_url
  • coords (latitude and longitude)
  • timestamp
  • ndvi and other multispectral indices
  • crop_type

At query time, the workflow retrieves the most relevant records, including all associated metadata, and passes them to the agent as context. This enables the agent to reference the original imagery, geographical location, and agronomic indicators when generating recommendations.

Tool Node and Memory: Connecting LangChain to the vector store

The template uses a Tool node to expose Supabase retrieval as a tool within the LangChain agent. This allows the agent to perform vector similarity search as part of its reasoning process.

A Memory node is also configured to maintain short-term conversational context or recent workflow state. This combination enables the agent to:

  • Reference the current query along with recently retrieved results
  • Preserve continuity across multiple related queries
  • Leverage the vector store as a structured, queryable knowledge base

Anthropic Chat & LangChain Agent: Reasoning and recommendations

The reasoning layer is implemented as a LangChain agent backed by an Anthropic chat model (or another compatible LLM). The agent receives:

  • The user or system query (for example, an agronomist asking about specific conditions)
  • Retrieved contexts from Supabase, including metadata and any NDVI or crop health indicators
  • A structured prompt template and response schema

You can tailor the agent’s instructions to focus on tasks such as:

  • Identifying potential disease, pest pressure, or nutrient deficiencies in the retrieved images
  • Assigning urgency levels such as immediate, monitor, or low priority
  • Producing concise intervention steps for field teams

For production deployments, keep prompts deterministic and constrained. Explicit response schemas and clear instructions significantly improve reliability and simplify downstream parsing.

Google Sheets: Logging, auditing, and reporting

The final stage of the workflow uses the Google Sheets node to append the agent’s structured outputs to a designated sheet. Typical columns include:

  • Image URL
  • Coordinates
  • NDVI or other indices
  • Agent-detected issue or risk
  • Urgency or alert level
  • Recommended action
  • Timestamp

Storing results in Sheets provides a quick, non-technical interface for stakeholders and a simple integration point for BI tools or alerting systems.

Step-by-step implementation guide

Prerequisites

  • An n8n instance (cloud-hosted or self-hosted)
  • OpenAI API key for embeddings
  • Supabase project with the vector extension configured
  • Anthropic API key (or an alternative LLM provider supported by LangChain)
  • A Google account with access to the target Google Sheet

1. Set up the Webhook endpoint

  • Create a Webhook node in n8n.
  • Configure the HTTP method as POST and define a path that your drone ingestion system will call.
  • If the endpoint is exposed publicly, secure it with mechanisms such as HMAC signatures, secret tokens, or an API key field in the payload.

2. Configure the text splitter

  • Add a text splitter node after the Webhook.
  • Set chunkSize to approximately 400 characters and chunkOverlap to around 40 for typical metadata and short notes.
  • For very long OCR outputs, experiment with lower overlap values to reduce token usage while preserving semantic continuity.

3. Connect and tune the embeddings node

  • Insert an OpenAI Embeddings node after the text splitter.
  • Select a suitable embeddings model, such as text-embedding-3-large.
  • Map the text chunks from the splitter into the embeddings input.
  • Include fields such as image_url, coords, timestamp, ndvi, and crop_type as metadata for each embedding.

4. Insert vectors into Supabase

  • Add a Supabase node configured for vector insert operations.
  • Specify an indexName such as drone_image_crop_health.
  • Ensure that the Supabase table includes columns for vector data and all relevant metadata fields.
  • Test inserts with a small batch of records before scaling up ingestion.

5. Implement query and agent orchestration

  • For query workflows, add a Supabase node configured to perform vector similarity search (top-K retrieval) based on an input query.
  • Feed the retrieved items into the LangChain agent node, along with a structured prompt template.
  • Design the prompt to include:
    • A concise system instruction
    • The retrieved contexts
    • A clear response schema, typically JSON, with fields such as alert_level, recommended_action, and confidence_score
  • Use the Tool node to expose Supabase as a retriever tool, and the Memory node to maintain short-term context if multi-turn interactions are required.

6. Configure logging and monitoring

  • Attach a Google Sheets node to append each agent response as a new row.
  • Log both the raw webhook payloads and the final recommendations for traceability.
  • Track throughput, latency, and error rates in n8n to identify bottlenecks.
  • Schedule periodic re-indexing if metadata is updated or corrected after initial ingestion.

Operational best practices

  • Attach visual context: Include image thumbnails or low-resolution previews in metadata to support quick manual verification of the agent’s conclusions.
  • Use numeric fields for indices: Store NDVI and multispectral indices as numeric columns in Supabase to enable structured filtering and analytics.
  • Secure access: Apply role-based access control (RBAC) to your n8n instance and Supabase project to minimize unauthorized access to field data.
  • Harden prompts: Test prompts extensively in a sandbox environment. Enforce strict response schemas to avoid ambiguous or unstructured outputs.
  • Cost management: Monitor spending across embeddings, LLM calls, and storage. Adjust chunk sizes and retrieval K values to balance performance, accuracy, and cost.

Example agent prompt template

The following template illustrates a structured prompt for the LangChain agent:

System: You are an agronomy assistant. Analyze the following retrieved contexts from drone imagery and provide a JSON response.
User: Retrieved contexts: {{retrieved_items}}
Task: Identify likely issues, urgency level (immediate / monitor / low), and one recommended action.
Response schema: {"issue":"", "urgency":"", "confidence":0-1, "action":""}

By enforcing a predictable JSON schema, you simplify downstream parsing in n8n and ensure that outputs can be reliably stored, filtered, and used by other systems.

Conclusion and next steps

This n8n and LangChain workflow template demonstrates a practical approach to automating drone-based crop health analysis. It integrates ingestion, embedding, vector search, LLM reasoning, and logging into a cohesive pipeline that can be adapted to different crops, geographies, and operational constraints.

To adopt this pattern in your environment:

  • Start with a small pilot deployment on a limited set of fields.
  • Iterate on chunk sizes, retrieval K values, and prompt design to optimize accuracy.
  • Once the workflow is stable, extend it with automated alerts (email or SMS), integration with farm management systems, or a geospatial dashboard that highlights hotspots on a map.

Call-to-action: If you want a ready-to-deploy n8n template or guidance on adapting this pipeline to your own drone imagery and agronomic workflows, reach out to our team or download the starter workflow to access a 30-day trial with assisted setup and tuning.


Published: 2025. Designed for agritech engineers, data scientists, and farm operations leaders implementing drone-based automation.

Build a Drink Water Reminder with n8n & LangChain

Build a Drink Water Reminder with n8n & LangChain

On a Tuesday afternoon, Mia stared at her screen and rubbed her temples. As the marketing lead for a fully remote team, she spent hours in back-to-back calls, writing campaigns, and answering Slack messages. By 4 p.m., she would realize she had barely moved and had forgotten to drink water again.

Her team was no different. Burnout, headaches, and fatigue were creeping in. Everyone agreed they needed healthier habits, but no one had the time or mental bandwidth to track something as simple as water intake.

So Mia decided to do what any automation-minded marketer would do: build a smart, context-aware “Drink Water Reminder” workflow using n8n, LangChain, OpenAI, Supabase, Google Sheets, and Slack.

The problem: reminders that feel spammy, not supportive

Mia had tried basic reminder apps before. They pinged people every hour, regardless of timezone, schedule, or workload. Her team quickly muted them.

What she really needed was a system that:

  • Understood user preferences and schedules
  • Could remember past interactions and adjust over time
  • Logged everything for analytics and optimization
  • Alerted her if something broke
  • Was easy to scale without rewriting logic from scratch

While searching for a solution, Mia discovered an n8n workflow template built exactly for this use case: a drink water reminder powered by LangChain, OpenAI embeddings, Supabase vector storage, Google Sheets logging, and Slack alerts.

Instead of a rigid reminder bot, she could build a context-aware agent using Retrieval-Augmented Generation (RAG) that actually “understood” the team’s habits and preferences.

Discovering the architecture behind the reminder

Before she customized anything, Mia explored how the template worked. The architecture was surprisingly elegant. At its core, the workflow used:

  • Webhook Trigger to receive external requests
  • Text Splitter to break long inputs into chunks
  • Embeddings (OpenAI) to convert text into vectors using text-embedding-3-small
  • Supabase Insert / Query to store and retrieve those embeddings in a vector index called drink_water_reminder
  • Vector Tool to expose that vector store to LangChain
  • Window Memory to keep short-term conversational context
  • Chat Model using OpenAI’s GPT-based chat completions
  • RAG Agent to orchestrate retrieval and generate personalized responses
  • Append Sheet to log every reminder in Google Sheets
  • Slack Alert to notify her team if anything failed

This was not just a “ping every hour” script. It was a small, intelligent system that could learn from previous messages and tailor its behavior over time.

Rising action: Mia starts building her reminder agent

Mia opened her n8n instance, imported the template, and started walking through each node. Her goal was simple: set up a robust, automated drink water reminder that her team would not hate.

1. Giving the workflow an entry point with Webhook Trigger

First, she configured the Webhook Trigger node. This would be the front door of the entire system, accepting POST requests from an external scheduler or other services.

She set the path to:

/drink-water-reminder

Each request would include a payload with fields like user_id, timezone, and any custom preferences her team wanted, such as preferred reminder frequency or working hours.

Now, whenever a scheduler hit that URL, the workflow would start.

2. Preparing content with the Text Splitter

Mia realized that some requests might contain longer instructions or context, not just a single line like “Remind me to drink water every hour.” To make sure the system could understand and store this information effectively, she turned to the Text Splitter node.

She configured it with character-based splitting using these settings:

chunkSize: 400
chunkOverlap: 40

This way, the content was broken into manageable chunks, with enough overlap to preserve meaning for semantic search. No chunk was too large to embed efficiently, and none lost important context.

3. Turning text into semantic memory with OpenAI embeddings

Next came the Embeddings (OpenAI) node. This is where the text chunks became vectors that the system could search and compare later.

She configured it to use the model:

text-embedding-3-small

After adding her OpenAI API credentials in n8n’s credential store, each chunk from the Text Splitter flowed into this node and came out as a vector representation, ready for storage in Supabase.

4. Storing context in Supabase: Insert node

To give the agent a long-term memory, Mia created a Supabase vector table and index named drink_water_reminder. This is where embeddings, along with helpful metadata, would live.

In the Supabase Insert node, she set the mode to insert and made sure each entry included:

  • user_id to tie data to a specific person
  • timestamp or created_at for tracking when it was stored
  • text containing the original chunk
  • Additional JSON metadata for any extra preferences

This structure would later allow the agent to retrieve relevant context, such as “Mia prefers reminders only between 9 a.m. and 6 p.m.”

5. Letting the agent “look things up” with Supabase Query and Vector Tool

Storing data is one thing. Using it intelligently is another. To make the agent capable of retrieving useful context, Mia configured the Supabase Query node to search the same drink_water_reminder index.

Then she added the Vector Tool node, which wrapped the Supabase vector store as a LangChain tool. This meant that when the RAG agent needed more information, it could call this tool and retrieve the most relevant entries.

In plain terms, the agent would not just guess. It would look up previous data and respond based on history.

6. Keeping conversations coherent with Window Memory

Mia wanted the system to handle follow-up prompts gracefully. For example, if a user said “Remind me every 2 hours” and then later added “But skip weekends,” the agent should understand that these messages belonged together.

To achieve this, she connected Window Memory to the RAG agent. This node buffers recent conversation pieces and provides short-lived context during a session. It does not store everything forever, but it helps the agent keep track of what just happened.

7. Giving the agent a voice: Chat Model and RAG Agent

Now it was time to define how the agent would actually respond.

Mia configured the Chat Model node to use OpenAI chat completions (GPT-based) and added her credentials. This model would generate natural language responses that felt friendly and helpful.

Then she moved to the heart of the system: the RAG Agent. This agent orchestrates three key elements:

  • Retrieval from the Vector Tool (long-term memory)
  • Short-term context from Window Memory
  • Generation of structured responses via the Chat Model

To define its behavior, she set a system message and prompt configuration like this:

systemMessage: "You are an assistant for Drink Water Reminder"
promptType: "define"
text: "Process the following data for task 'Drink Water Reminder':\n\n{{ $json }}"

This told the agent exactly what role it should play and how to treat the incoming data. The agent would then output structured status text, which could be logged and analyzed later.

8. Logging everything in Google Sheets with Append Sheet

As a marketer, Mia loved data. She wanted to know how often reminders were sent, how they performed, and whether the team was actually engaging with them.

To make this easy, she connected an Append Sheet node to a Google Sheet named Log. Each time the RAG agent produced an output, the workflow appended a new row with a Status column that captured the agent’s response.

She configured OAuth for Google Sheets in n8n, so credentials stayed secure and easy to manage.

9. Staying ahead of issues with Slack Alert

The final piece was resilience. Mia did not want a silent failure where reminders simply stopped working without anyone noticing.

She added a Slack Alert node and connected it to the RAG Agent’s onError path. Whenever the workflow encountered an error, a message would be posted to the #alerts channel in Slack.

This way, if Supabase, OpenAI, or Google Sheets had an issue, her team would know quickly and could respond.

Turning point: testing the drink water reminder in real life

With the architecture in place, it was time for the moment of truth. Mia ran a full test of the workflow.

Step 1: Sending a test POST request

She sent a POST request to her n8n webhook URL with a payload like:

{  "user_id": "mia",  "text": "Remind me to drink water every hour",  "timezone": "Europe/Berlin"
}

Step 2: Watching the nodes execute

In the n8n editor, she watched the execution flow:

  • The Webhook Trigger received the request
  • The Text Splitter broke the text into chunks
  • The Embeddings node generated vectors
  • The Supabase Insert node stored them in the drink_water_reminder index

No errors. So far, so good.

Step 3: Simulating a query and agent response

Next, she triggered a query flow to simulate the agent retrieving context for Mia’s reminders. The Supabase Query and Vector Tool located relevant entries, and the RAG Agent used them to generate a helpful message tailored to her preferences.

The response felt surprisingly personal, referencing her hourly preference and timezone.

Step 4: Verifying logs and alerts

Finally, she checked the Google Sheet. A new row had been added to the Log sheet, with the agent’s output neatly stored in the Status column.

She also confirmed that if she forced an error (for example, by temporarily misconfiguring a node), the Slack Alert fired correctly and posted a message to #alerts.

The system was working end-to-end.

Behind the scenes: practical tips Mia followed

To keep the workflow secure, scalable, and cost-effective, Mia applied a few best practices while setting everything up.

Securing credentials and schema design

  • Secure credentials: All OpenAI, Supabase, Google Sheets, and Slack credentials were stored in n8n’s credential store. She never hardcoded API keys in the workflow.
  • Schema design in Supabase: Her vector table included fields like user_id, text, created_at, and a JSON metadata column. This made search results more actionable and easier to filter.

Managing costs, retries, and monitoring

  • Rate limits and costs: Since embeddings and chat completions incur costs, she kept chunk sizes reasonable and batched writes where possible.
  • Idempotency: To guard against duplicate inserts when schedulers retried the webhook, she implemented idempotency keys on the incoming requests.
  • Monitoring: She enabled execution logs in n8n and relied on Slack alerts to catch failed runs or sudden spikes in error rates.

Expanding the vision: future use cases and enhancements

Once the basic reminder system was live, Mia started imagining how far she could take it.

  • Personalized cadence: Adjust reminder frequency based on each user’s history in Supabase, such as sending fewer reminders if they consistently acknowledge them.
  • Multi-channel reminders: Extend the workflow to send messages via email, SMS, Slack DM, or push notifications, depending on user preference.
  • Analytics dashboard: Build a dashboard on top of the Google Sheets data or Supabase to visualize how often reminders are sent, accepted, or ignored.
  • Smart nudges: Introduce escalation logic that only increases reminders when users repeatedly ignore them, making the system helpful instead of nagging.

Keeping data safe: security and privacy considerations

Mia knew that even something as simple as a water reminder could include personal details like schedules and habits. She took extra care to protect her team’s data.

She made sure to:

  • Minimize stored personal data to what was truly necessary
  • Enforce row-level security in Supabase so users could only access their own records
  • Rotate API keys regularly and avoid exposing them in logs or code

If the system ever expanded to include more health-related data, she planned to review applicable privacy laws and adjust accordingly.

When things go wrong: Mia’s troubleshooting checklist

To make future debugging easier, Mia documented a quick troubleshooting list for herself and her team.

  • Webhook returns 404: Confirm the path is correct and deployed, for example /webhook/drink-water-reminder in n8n.
  • Embeddings fail: Check that the OpenAI key is valid and the model name is correctly set to text-embedding-3-small.
  • Supabase insert/query errors: Verify the table schema, ensure the vector extension is enabled, and confirm the index name drink_water_reminder.
  • RAG Agent output is poorly formatted: Refine the systemMessage and prompt template so the agent consistently returns structured output.

Resolution: a small habit, a big impact

A few weeks after deploying the workflow, Mia noticed a quiet shift in her team. People started joking in Slack about “their water bot,” but they also reported fewer headaches and more energy in afternoon meetings.

The reminders felt personal, not spammy. The system respected timezones, remembered preferences, and adapted over time. And when something broke, the Slack alerts let her fix it before anyone complained.

Under the hood, it was all powered by n8n, LangChain, OpenAI embeddings, Supabase vector storage, Google Sheets logging, and Slack alerts. On the surface, it was just a friendly nudge to drink water.

For Mia, it proved a bigger point: with the right automation and a bit of semantic intelligence, even the smallest habits can be supported at scale.

Ready to build your own drink water reminder?

If you want to create a similar experience for your team, you do not need to start from scratch. This n8n + LangChain template gives you a robust foundation for context-aware reminders that feel genuinely helpful.

  • Use embeddings and vector search to store and retrieve user context
  • Leverage Window Memory and a RAG agent for smarter, personalized responses
  • Log everything to Google Sheets for analytics and optimization
  • Wire Slack alerts so you never miss a failure

Next steps: Deploy the workflow in your n8n instance, connect your credentials, and run a few test requests. Then iterate on the prompts, channels, and cadence to match your users.

Call to action: Try this template today in your n8n environment and share the results with your team. If you need help customizing it, reach out to a

Build an Achievement Suggestion Engine with n8n

Build an Achievement Suggestion Engine with n8n, LangChain and Supabase

This guide documents an n8n workflow template that implements an Achievement Suggestion Engine using text embeddings, a Supabase vector store, and an agent-style orchestration with LangChain and a Hugging Face model. It explains the workflow architecture, node configuration, data flow, and practical considerations for running the template in production-like environments.

1. Conceptual Overview

The Achievement Suggestion Engine transforms raw user content into personalized achievement recommendations. It combines semantic search with agent logic so that your application can:

  • Convert user text (profiles, activity logs, goals) into dense vector embeddings for semantic similarity search
  • Persist those vectors in a Supabase-backed vector store for fast nearest-neighbor queries
  • Use a LangChain-style agent with a Hugging Face LLM to interpret retrieved context and generate achievement suggestions
  • Log outputs to Google Sheets for monitoring, analytics, and auditability

The n8n workflow is structured into two primary flows:

  • Ingest (write path) – receives user content, chunks it, embeds it, and stores it in Supabase
  • Query (read path) – retrieves relevant content from Supabase, feeds it into an agent, and generates suggestions that are logged and optionally returned to the caller

2. High-level Architecture

At a high level, the template uses the following components:

  • Webhook node to accept incoming HTTP POST requests from your application
  • Text splitter to perform chunking of long documents
  • Embeddings node (Hugging Face) to convert text chunks into vectors
  • Supabase vector store to store and query embeddings (index name: achievement_suggestion_engine)
  • Vector search + tool node to expose Supabase search as a tool to the agent
  • Conversation memory buffer to keep recent interaction context
  • Chat / Agent node using a Hugging Face LLM and LangChain agent logic
  • Google Sheets node to append suggestion logs for analytics and review

The ingest and query flows can be triggered from the same webhook or separated logically, depending on how you configure routing at the application layer.

3. Data Flow: Ingest vs Query

3.1 Ingest Flow (Write Path)

The ingest flow is responsible for turning user content into searchable vectors.

  1. The Webhook node receives a POST payload containing user content such as a profile, activity feed, or event description.
  2. The payload is passed to the Splitter node, which chunks the text into segments suitable for embedding.
  3. Each chunk is processed by the Embeddings node (Hugging Face) to generate vector representations.
  4. The Insert operation writes the resulting vectors into the Supabase vector store, using the index achievement_suggestion_engine and attaching relevant metadata (for example user ID, timestamps, and source identifiers).

3.2 Query Flow (Read Path)

The query flow retrieves the most relevant stored content and uses it to generate achievement suggestions.

  1. A user request or event triggers a Query operation against Supabase, which performs a semantic similarity search over the stored embeddings.
  2. The Tool node wraps the vector search capability as a LangChain-compatible tool so it can be invoked by the agent.
  3. The Agent node uses the tool results, conversation memory, and a configured prompt to generate personalized achievement suggestions.
  4. The final suggestions are sent to a Google Sheets node, which appends a new row with user identifiers, timestamps, and the generated output. The same response can be returned from n8n to the caller if desired.

4. Node-by-node Breakdown

4.1 Webhook Node (Ingress)

The Webhook node is the entry point for both ingestion and query operations. It listens for HTTP POST requests from your application.

  • Trigger type: HTTP Webhook
  • Supported method: POST
  • Payload: JSON body containing fields such as user_id, timestamp, and content (see sample below)

You can use a single webhook and route based on payload fields (for example, a mode flag), or maintain separate workflows for ingest and query paths. In all cases, validating the payload format and returning appropriate HTTP status codes helps prevent downstream errors.

4.2 Splitter Node (Text Chunking)

The Splitter node receives the raw text content and breaks it into smaller segments for embeddings. This improves retrieval quality and prevents hitting model token limits.

  • Key parameters:
    • chunkSize: 400 – maximum characters per chunk
    • chunkOverlap: 40 – number of overlapping characters between consecutive chunks

The template uses 400/40 as a balanced default. It preserves enough context for semantic meaning while keeping the number of embeddings manageable. Overlap of around 10 percent helps maintain continuity across chunk boundaries without excessive duplication.

Edge case to consider: very short inputs that are smaller than chunkSize will not be split further and are passed as a single chunk, which is typically acceptable.

4.3 Embeddings Node (Hugging Face)

The Embeddings node converts each text chunk into a dense vector using a Hugging Face model.

  • Provider: Hugging Face
  • Typical model type: sentence-level embedding models such as sentence-transformers families (exact model is selected in your credentials/config)
  • Input: text chunks from the Splitter node
  • Output: numeric vectors suitable for insertion into a vector store

When choosing a model, balance accuracy against latency and resource usage. Before promoting to production, evaluate semantic recall and precision on a representative dataset.

4.4 Insert Node (Supabase Vector Store)

The Insert node writes embeddings into Supabase, which acts as the vector store.

  • Index name: achievement_suggestion_engine
  • Backend: Supabase (Postgres with vector extension)
  • Operation: insert embeddings and associated metadata

Alongside the vector itself, you should store structured metadata, such as:

  • user_id for tenant-level filtering
  • timestamp to support time-based analysis or cleanup
  • chunk_index to reconstruct document order if needed
  • Source identifiers (for example document ID or event type)

This metadata is important for downstream filtering, debugging, and audits. It also enables more granular queries, such as restricting search to a single user or time range.

4.5 Query + Tool Nodes (Vector Search + Agent Tool)

On the read path, the workflow performs a vector search in Supabase and exposes the results as a tool to the agent.

  • Query node:
    • Accepts a query embedding or text that is converted to an embedding
    • Performs nearest-neighbor search against the achievement_suggestion_engine index
    • Returns the most similar chunks along with their metadata
  • Tool node:
    • Wraps the vector search capability as a LangChain-style tool
    • Makes retrieval callable by the agent as needed during reasoning

The agent uses this tool to fetch context dynamically instead of relying solely on the initial prompt. This pattern is particularly useful when the underlying vector store grows large.

4.6 Memory Node (Conversation Buffer)

The Memory node maintains a sliding window of recent conversation turns. This allows the agent to keep track of previous suggestions, user feedback, or clarifications.

  • Type: conversation buffer
  • Key parameter: memoryBufferWindow which controls how many recent messages are retained

A larger window provides richer context but increases token usage for each agent call. Tune this value based on the typical length of your user interactions and cost constraints.

4.7 Chat / Agent Node (Hugging Face LLM + LangChain Agent)

The Chat / Agent node orchestrates the LLM, tools, and memory to generate achievement suggestions.

  • LLM provider: Hugging Face
  • Agent framework: LangChain-style agent within n8n
  • Inputs:
    • Retrieved context from the vector store tool
    • Conversation history from the memory buffer
    • System and user prompts defining the task and constraints
  • Output: structured or formatted achievement suggestions

The prompt typically instructs the agent to:

  • Analyze user behavior and goals extracted from context
  • Map these to a set of potential achievements
  • Prioritize or rank suggestions
  • Format the response in a predictable structure such as JSON or CSV

You should also include fallback instructions for cases where the context is weak or no strong matches are found, for example instructing the agent to respond with a default message or an empty list.

4.8 Google Sheets Node (Logging)

The final step logs the agent output to Google Sheets for inspection and analytics.

  • Operation: append rows to a specified sheet
  • Typical fields:
    • User identifiers
    • Timestamp of the request or suggestion generation
    • Raw or formatted achievement suggestions

This approach is convenient for early-stage experimentation and manual review. For higher throughput or stricter consistency requirements, you may later replace or complement Sheets with a transactional database.

5. Configuration Notes & Best Practices

5.1 Chunking Strategy

Chunking has a direct impact on retrieval quality and cost.

  • Chunk size:
    • Larger chunks preserve more context but increase embedding cost and may dilute the signal for specific queries.
    • Smaller chunks improve granularity but can lose cross-sentence context.
  • Overlap:
    • Overlap helps maintain continuity between chunks when sentences span boundaries.
    • About 10 percent overlap, as used in the template, is a strong starting point.

Test with your own data to determine whether to adjust chunkSize or chunkOverlap for optimal recall.

5.2 Selecting an Embeddings Model

For best results, use a model designed for semantic similarity:

  • Prefer sentence-level encoders such as those in the sentence-transformers family or similar Hugging Face models.
  • Evaluate performance on a small labeled set of queries and documents to confirm that similar items cluster as expected.
  • Consider latency and throughput, especially if your ingest volume or query rate is high.

5.3 Designing the Supabase Vector Store

Supabase provides a managed Postgres instance with a vector extension, which is used as the vector store in this template.

  • Use the achievement_suggestion_engine index for all embeddings related to the engine.
  • Include metadata fields such as:
    • user_id for multi-tenant isolation
    • source_id or document ID for traceability
    • timestamp to support time-based retention and analysis
    • chunk_index to reconstruct original ordering if needed

This metadata makes it easier to filter search results, enforce access control, and debug unexpected suggestions.

5.4 Agent Prompting and Safety

Well-structured prompts are critical for consistent and safe suggestions.

  • Clearly define the task, such as:
    • Suggest up to 5 achievements based on the context and user goals.
  • Specify a strict output format, for example JSON or CSV, so that downstream systems can parse responses reliably.
  • Provide guidelines for low-context scenarios, such as:
    • Return a minimal default suggestion set.
    • Explicitly state when there is insufficient information to make recommendations.

Incorporating these constraints helps reduce hallucinations and ensures that the agent behaves predictably under edge cases.

5.5 Logging & Observability

The template uses Google Sheets as a simple logging backend:

  • Append each agent output as a new row, including identifiers and timestamps.
  • Use the sheet to monitor suggestion quality, identify anomalies, and iterate on prompts.

For production environments, consider:

  • Forwarding logs to a dedicated database or observability platform.
  • Storing raw requests, responses, and vector IDs to support traceability and debugging.
  • Monitoring error rates and latency for each node in the workflow.

6. Security, Privacy, and Cost Considerations

Handling user content in an AI pipeline requires careful attention to security and cost.

  • Security & access control:
    • Encrypt data in transit with HTTPS and ensure data at rest is protected.
    • Use Supabase row-level security or policies to restrict access to user-specific data.
  • Privacy:
    • Mask or

Autonomous Vehicle Log Summarizer with n8n & Weaviate

Autonomous Vehicle Log Summarizer with n8n & Weaviate

Automated and autonomous fleets generate massive volumes of telemetry and diagnostic text logs across perception, planning, control, and sensor subsystems. Turning these raw logs into concise, queryable summaries is critical for debugging, compliance, and operational visibility. This reference guide documents a production-ready n8n workflow template – Autonomous Vehicle Log Summarizer – that uses embeddings, Weaviate, and an LLM agent to ingest logs, index them semantically, generate summaries, and persist structured insights into Google Sheets.

1. Functional overview

The workflow automates the end-to-end lifecycle of autonomous vehicle log analysis. At a high level, it:

  • Receives raw log payloads via an n8n Webhook node.
  • Splits large log bodies into overlapping chunks suitable for embedding and LLM context.
  • Generates vector embeddings using a HuggingFace embeddings model.
  • Stores vectors and metadata in a Weaviate vector index named autonomous_vehicle_log_summarizer.
  • Exposes the vector store as a Tool to an LLM agent for retrieval-augmented generation (RAG).
  • Uses an OpenAI Chat / Agent node to produce incident summaries and structured attributes such as severity and likely cause.
  • Writes final structured results to Google Sheets for reporting and downstream workflows.

The automation is designed for fleets where manual log inspection is infeasible. It supports:

  • Rapid extraction of key events such as near-misses or sensor failures.
  • Human-readable summaries for engineers, operations, and management.
  • Semantic search across historical incidents via Weaviate.
  • Integration with follow-up workflows such as ticketing or alerting.

2. System architecture

2.1 Core components

The template uses the following n8n nodes and external services:

  • Webhook node – Ingestion endpoint for HTTP POST requests containing log data.
  • Text Splitter node – Chunking of long logs into overlapping segments.
  • HuggingFace Embeddings node – Vectorization of text chunks.
  • Weaviate Insert node – Persistence of embeddings and metadata.
  • Weaviate Query node – Retrieval of relevant chunks for a given query.
  • Vector Store Tool node – Tool abstraction that exposes Weaviate search to the LLM agent.
  • Memory node (optional) – Short-term conversational context for multi-step agent interactions.
  • OpenAI Chat / Agent node – LLM-based summarization and field extraction.
  • Google Sheets node – Appending summaries and structured metadata to a spreadsheet.

2.2 Data flow sequence

  1. Log ingestion Vehicles, edge gateways, or upstream ingestion services POST log bundles to the configured n8n webhook URL. Payloads may be JSON, plain text, or compressed bodies that you decode upstream or within the workflow.
  2. Preprocessing and chunking The raw log text is split into fixed-size overlapping chunks. This improves embedding quality and prevents truncation in downstream LLM calls.
  3. Embedding generation Each chunk is passed to the HuggingFace Embeddings node, which produces a vector representation using the selected model.
  4. Vector store persistence Embeddings and associated metadata (vehicle identifiers, timestamps, module tags, etc.) are inserted into Weaviate under the autonomous_vehicle_log_summarizer index (class).
  5. Retrieval and RAG When a summary is requested or an automated trigger fires, the workflow queries Weaviate for relevant chunks. The Vector Store Tool exposes this retrieval capability to the agent node.
  6. LLM summarization The OpenAI Chat / Agent node consumes retrieved snippets as context and generates a concise incident summary plus structured fields such as severity, likely cause, and recommended actions.
  7. Result persistence The Google Sheets node appends the final structured output to a target sheet, making it available for audits, dashboards, and additional automation such as ticket creation or alerts.

3. Node-by-node breakdown

3.1 Webhook node – log ingestion

The Webhook node is the entry point for all log data.

  • Method: Typically configured as POST.
  • Payload types: JSON, raw text, or compressed data that you decode before splitting.
  • Common fields:
    • vehicle_id
    • software_version
    • log_timestamp
    • location or geo-region
    • module (for example, perception, control, planning)
    • log_body (the raw text to be summarized and indexed)

If upstream systems do not provide metadata, you can enrich the payload in n8n using additional nodes before chunking. This metadata is later stored in Weaviate to enable filtered semantic queries.

3.2 Text Splitter node – log chunking

Long logs are split into overlapping character-based segments to:

  • Preserve semantic continuity across events.
  • Fit within model token limits for embeddings and LLM context.
  • Improve retrieval granularity when querying Weaviate.

Recommended initial configuration:

  • chunkSize: 400 characters
  • chunkOverlap: 40 characters

These values are a starting point. Adjust them based on:

  • Typical log length and density of events.
  • Token limits and performance characteristics of your embedding model.
  • Desired retrieval resolution (shorter chunks for more granular search, larger chunks for more context per match).

Edge case consideration: if logs are shorter than chunkSize, the Text Splitter will typically output a single chunk. Ensure downstream nodes handle both single-chunk and multi-chunk cases without branching errors.

3.3 HuggingFace Embeddings node – vectorization

The HuggingFace Embeddings node converts each text chunk into a numerical vector suitable for similarity search.

  • Model selection: Choose a HuggingFace embeddings model that balances cost, latency, and semantic quality for your use case.
  • Credentials: Configure your HuggingFace credentials in n8n to allow API access where required.
  • Metadata: It is recommended to store the model name and version in the metadata alongside each chunk to keep the index reproducible and auditable over time.

For early experimentation, smaller models can reduce latency and cost. For detailed root cause analysis or high-stakes incidents, higher-quality models may be justified even at higher resource consumption.

3.4 Weaviate Insert node – embedding persistence

The Weaviate Insert node writes embeddings and metadata into a Weaviate instance.

  • indexName / class: autonomous_vehicle_log_summarizer
  • Data stored:
    • Vector embedding for each chunk.
    • Chunk text.
    • Metadata such as:
      • vehicle_id
      • log_timestamp
      • module (for example, perception, control)
      • software_version
      • source_file or log reference.
      • Embedding model identifier.

This metadata enables filtered semantic search, for example:

  • Restricting queries to a specific vehicle or subset of vehicles.
  • Limiting search to a time range.
  • Filtering by module when investigating a particular subsystem.

For large fleets, consider retention policies at the Weaviate level to manage index growth and storage costs.

3.5 Weaviate Query node & Vector Store Tool – retrieval

When an engineer initiates an investigation or when an automated process runs, the workflow queries Weaviate to retrieve the most relevant chunks for the incident under review.

  • Query source: Could be a natural language question, a vehicle-specific query, or a generic request for recent incidents.
  • Weaviate Query node: Performs vector similarity search, optionally with filters based on metadata (for example, vehicle_id or time window).
  • Vector Store Tool node: Wraps the query capability as a Tool that the LLM agent can call during reasoning. This enables retrieval-augmented generation (RAG) where the agent dynamically fetches supporting context.

The retrieved chunks are passed to the agent as context snippets. The workflow should handle cases where:

  • No relevant chunks are found (for example, return a fallback message or low-confidence summary).
  • Too many chunks are retrieved (for example, limit the number of chunks or total tokens passed to the LLM).

3.6 Memory node – conversational context (optional)

A Memory node can be added to maintain short-term context across multiple agent turns. This is useful when:

  • Engineers ask follow-up questions about the same incident.
  • The agent needs to refine or extend previous summaries without reloading all context.

Keep memory limited to avoid unnecessary token usage and to prevent older, less relevant context from influencing new summaries.

3.7 OpenAI Chat / Agent node – summarization and extraction

The OpenAI Chat / Agent node orchestrates the LLM-based summarization and field extraction. It uses:

  • The retrieved log snippets as context.
  • The Vector Store Tool to fetch additional context if needed.
  • A structured prompt that defines the required outputs (summary, severity, cause, actions).

Typical outputs include:

  • One-sentence incident summary.
  • Severity classification such as Low, Medium, or High.
  • Likely cause as a short textual explanation.
  • Recommended immediate action for operators or engineers.

To simplify downstream processing, you can instruct the agent to return a consistent format (for example, JSON or a delimited string). The template uses a clear, explicit prompt to drive consistent, concise outputs.

3.8 Google Sheets node – result storage

The final step appends the agent output and relevant metadata to a Google Sheets document.

  • Operation: Typically Append or Add Row.
  • Columns may include:
    • Incident timestamp.
    • vehicle_id.
    • Summary sentence.
    • Severity level.
    • Likely cause.
    • Recommended action.
    • Link or reference to the original log or Weaviate object ID.

These rows can trigger additional automations (for example, ticket creation, notifications) or feed dashboards for fleet monitoring.

4. Configuration details and best practices

4.1 Chunking strategy

Effective chunking is crucial for high-quality retrieval.

  • Use chunkSize values large enough to capture full events such as error traces or sensor dropout sequences.
  • Increase chunkOverlap when events span boundaries so that each chunk contains enough context for the LLM to interpret the issue.
  • Monitor LLM token usage and adjust chunk parameters to avoid exceeding context limits during summarization.

4.2 Embedding model selection

Model choice impacts accuracy, latency, and cost.

  • For early-stage deployments or high-throughput pipelines, smaller HuggingFace models can be sufficient and cost-effective.
  • For high-precision tasks such as detailed root cause analysis, consider more capable embeddings models even if they are more resource-intensive.
  • Record the model name and version in metadata for future reproducibility and auditability.

4.3 Metadata design and filtering

Rich metadata in Weaviate is essential for accurate and targeted retrieval.

  • Include fields such as:
    • vehicle_id
    • module
    • geo_region or location.
    • software_version.
    • Log-level or severity if available.
  • Use these fields in Weaviate filters to:
    • Limit queries to specific vehicles or fleets.
    • Focus on a given time window.
    • Reduce hallucination risk by narrowing the search space.

4.4 Prompt design for the agent

The agent prompt should explicitly define the required outputs and format. A sample prompt used in the template is:

Analyze the following retrieved log snippets and produce:
1) One-sentence summary of the incident
2) Severity: Low/Medium/High
3) Likely cause (one line)
4) Recommended immediate action

Context snippets:
{{retrieved_snippets}}  

For production use:

  • Specify a strict output structure such as JSON keys or CSV-style fields.
  • Constrain the maximum length for each field to keep Google Sheets rows compact.
  • Remind the model to base conclusions only on provided context and to state uncertainty when context is insufficient.

4.5 Security and compliance considerations

Autonomous vehicle logs may contain sensitive telemetry or indirectly identifiable information.

  • Encrypt data in transit and at rest for:
    • Weaviate storage.
    • Google Sheets.
    • Backups and intermediate storage layers.
  • Redact or hash sensitive identifiers such as VINs or driver