Automated Real Estate Market Trend Report: Build a Smart Data Pipeline
Imagine never having to manually piece together a market update again. No more copy-pasting from MLS exports, wrangling spreadsheets, or trying to remember which neighborhood you analyzed last week.
That is exactly what this n8n workflow template is built to solve. It pulls in your real estate data, breaks it into useful chunks, turns it into semantic embeddings, stores everything in a vector database, then uses an LLM-powered agent to generate polished, data-backed market trend reports. All on autopilot.
Under the hood, the workflow uses:
- n8n for orchestration and automation
- Cohere for generating text embeddings
- Weaviate as the vector database
- An LLM-based agent for analysis, writing, and logging
- Google Sheets for storing outputs and logs
Let us walk through what the template does, when to use it, and how the workflow actually works in practice.
Why automate your real estate market trend reports?
If you have ever tried to produce weekly or monthly market updates by hand, you know how painful it can be. Pull data, clean it, analyze it, write it up, format it, share it. Then do it all again next week.
This is where an automated n8n workflow really shines. With a smart pipeline in place, you get:
- Faster turnaround – spin up daily or weekly reports with no manual processing.
- Consistent methodology – the same logic runs every time, which makes trends easier to compare over time.
- Scalability – duplicate the process across multiple neighborhoods, cities, or property types without extra effort.
- Actionable outputs – send results to Google Sheets, dashboards, or email so your team can use them immediately.
If you are an agent, investor, analyst, or part of a brokerage or proptech team, this kind of automation can quietly become your “always-on” market intelligence engine.
What this n8n template actually does
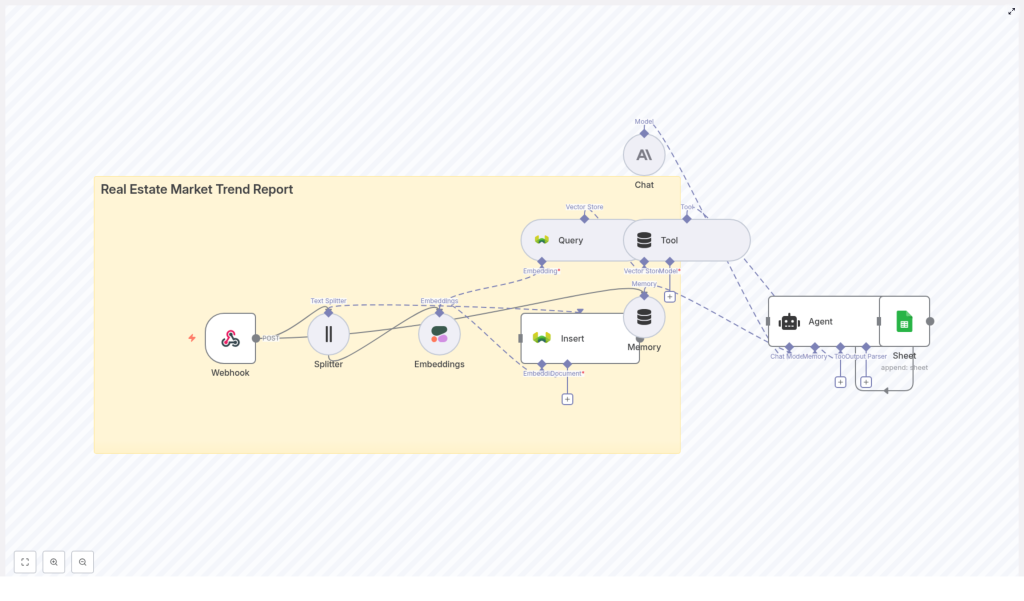
Let us zoom out for a second and look at the overall architecture before diving into each step. The workflow is modular and built as a data pipeline:
- Webhook – receives raw real estate data like CSVs, JSON feeds, or outputs from scraping tools.
- Text Splitter – breaks long text (descriptions, commentary, news) into smaller chunks.
- Embeddings (Cohere) – converts those chunks into dense vectors that capture semantic meaning.
- Vector Store (Weaviate) – stores vectors plus metadata and supports fast semantic search.
- Query/Tool – retrieves the most relevant chunks when the agent needs context.
- Memory – lets the agent keep short-term context across multi-step tasks.
- Agent (LLM) – analyzes the data, writes the market trend report, and formats the output.
- Google Sheets – stores logs, metrics, and final report data for dashboards or review.
In practice, that means you send in property and market data at one end and get a clean, narrative-style market report out the other end, backed by real numbers and citations.
Step-by-step: how the workflow runs in n8n
1. Capture your data with a webhook
Everything starts with the webhook node in n8n. This is your pipeline’s front door.
You can send data to this webhook from:
- MLS feeds
- Web scrapers
- Property APIs
- CSV uploads or exports
Whenever new data hits the webhook, n8n automatically triggers the workflow. No buttons to click, no scripts to run. You just keep feeding it data, and it keeps producing insights.
2. Split and normalize the text for analysis
Real estate data rarely arrives in a neat, tidy format. Listing descriptions are long, market commentary can be verbose, and news feeds often come as big blocks of text.
The text splitter in the workflow helps by:
- Breaking long documents into smaller chunks, typically around 300-500 characters each.
- Adding a bit of overlap between chunks so context is not lost between splits.
- Normalizing key fields like price, location, bedrooms into a structured JSON format for later analysis.
This step is essential for two reasons: it keeps your data within model limits and makes the embeddings more meaningful and consistent.
3. Turn text into embeddings with Cohere
Next, each chunk of text is sent to an embeddings model, such as Cohere. This is where the workflow becomes “semantic” instead of just keyword-based.
Embeddings transform text into numerical vectors that represent meaning. That way, when you later search for something like “rental yield near downtown,” the system can find relevant text even if the exact phrase never appears. Phrases like “strong investor returns in the city center” will still be picked up because they are semantically similar.
4. Store everything in a vector database
Once embeddings are generated, they are stored in Weaviate or another vector store, along with useful metadata. Typical metadata fields include:
- Property ID
- Date
- Price
- Neighborhood
- Source (MLS, scraper, API, etc.)
With this setup, you can run semantic searches filtered by neighborhood, property type, or time period, which is incredibly powerful for dynamic market reports.
5. Retrieve relevant context for the report
When it is time to build a report, the workflow uses a query/tool node to ask the vector store for exactly the context it needs. For example, the agent might query:
“Recent price trend for 2-bedroom apartments in Neighborhood X over the last 90 days.”
Weaviate then returns the most relevant chunks and their metadata. That becomes the factual backbone of the report, rather than the agent trying to “guess” or hallucinate trends.
6. Let the LLM agent analyze and write the report
Now the fun part. The agent node, powered by an LLM, takes the retrieved context and follows a prompt template to generate a structured market trend report.
Typically, the agent will:
- Summarize price trends and transaction volumes.
- Extract metrics like median and average price, days on market, and inventory changes.
- Highlight outliers and potential drivers, such as new construction, zoning updates, or seasonal patterns.
- Produce a clear narrative and recommendations tailored to buyers, sellers, or investors.
The agent also uses memory to keep track of context across multiple steps, which helps if your workflow involves multi-part analysis or follow-up queries.
Because the agent is grounded in data from the vector store, the risk of hallucination is much lower. You can also audit where insights came from by looking at the original chunks and metadata.
7. Log and share results with Google Sheets
Finally, the workflow writes key outputs and logs to Google Sheets. This can include:
- Report headlines and summaries
- Key metrics and trends
- Run metadata, such as timestamps and model versions
- Error logs or flags for failed runs
From there, you can plug the sheet into your BI tool, create dashboards, or simply share it with your team. It is a simple way to keep everything transparent and easy to review.
Practical ways to use this template
So where does this workflow really shine in real life? Here are a few common use cases:
- Weekly neighborhood snapshots for real estate agents who want quick, consistent updates to send to clients.
- Investor-focused reports that highlight rental yields, cap rates, and performance by submarket.
- Competitive market intelligence comparing listing descriptions, pricing strategies, and positioning.
- Automated alerts for sudden price swings, changing inventory levels, or new trends in specific areas.
If you are juggling multiple markets or client segments, this template helps you keep them all covered without burning out on manual analysis.
Best practices to get better results
1. Focus on data quality
Any pipeline is only as good as the data feeding it. To keep your reports trustworthy:
- Normalize important fields like prices and dates at ingestion.
- Validate incoming data and handle obvious errors or missing values.
- Tag data by source and, where possible, keep the raw payload for audit purposes.
2. Tune your chunk size and overlap
Chunking might sound like a small detail, but it has a big impact on retrieval quality. As a starting point:
- Try around 400 characters per chunk.
- Add about 40 characters of overlap between chunks.
Too-small chunks lose context, while too-large chunks can cause token limits and muddy the semantic meaning. Feel free to experiment based on your typical text length.
3. Choose the right embeddings model
Real estate text is often short and packed with details. When picking an embeddings model (such as Cohere):
- Look for strong performance on short-form, domain-specific text.
- Test different cosine similarity thresholds to balance precision and recall in retrieval.
Good embeddings mean the agent sees the right context and produces more accurate insights.
4. Design a useful vector store schema
In Weaviate, you are not just storing vectors. You are also defining how you will query them later. A helpful schema might include fields like:
property_typeneighborhoodpricedate_listedsource
This lets you combine semantic search with structured filters, which is ideal for real estate use cases.
5. Invest a bit of time in prompt engineering
The agent’s prompt is where you define what a “good” report looks like. It is worth getting specific. For example, your prompt can:
- Lay out the expected sections of the report.
- Specify the tone (professional, neutral, investor-focused, etc.).
- Require numeric fields like median price, percent change, or days on market.
- Ask the agent to cite evidence, such as: “Source: Listing ID 12345 – price change +5%.”
Clear instructions lead to reports that feel consistent, polished, and trustworthy.
6. Monitor runs and version your setup
Since this is an automated system, you want to know when something changes or breaks. Good habits include:
- Logging each run to Google Sheets with timestamps and statuses.
- Tracking embedding and model versions so you can compare performance over time.
- Watching costs and setting alerts for failures or unexpected data patterns.
This keeps your automation reliable as you scale it up.
Security and compliance considerations
Real estate data can include sensitive information. When using this workflow:
- Be mindful of PII and your organization’s data retention policies.
- Use secure API keys and lock down access to your vector store.
- Anonymize personal identifiers if required by law or internal policy.
Building security in from day one saves you a lot of headaches later.
Costs and scaling: what to expect
As you roll this out across more markets or time periods, a few cost factors come into play:
- Embeddings and LLM calls are usage-based. Batch operations where possible to reduce the number of calls.
- Vector storage grows with the number of embeddings. In Weaviate, you can use metadata pruning or TTL policies to manage older data.
- n8n hosting can be self-hosted or cloud-hosted. Self-hosting gives you more cost control, but you are responsible for maintenance.
The nice part is that you can start small and scale gradually as you see value.
Quick start checklist
Ready to try this in your own setup? Here is a simple checklist to get from idea to running workflow:
- Identify your data sources (MLS feeds, scrapers, property APIs, CSV exports).
- Set up an n8n webhook and ingestion flow to capture incoming data.
- Configure your text splitter and connect your embedding provider (Cohere, OpenAI, etc.).
- Provision a vector store like Weaviate and design your schema and metadata fields.
- Craft and test your agent prompts for report generation and tone.
- Send outputs to Google Sheets or your BI tool, then schedule your workflow to run on a regular cadence.
What a finished report can look like
Your generated market trend report can be structured in a clear, repeatable format, for example:
- Headline – a one-sentence summary, such as “Downtown 2-bed prices rose 4% in the last 30 days.”
- Key metrics – median price, percent change, new listings, average days on market.
- Market narrative – 3 to 5 bullet points capturing the story behind the numbers.
- Recommendations – practical actions for buyers, sellers, or investors.
- Data sources and citations – references back to listings or datasets used in the analysis.
This structure keeps reports both digestible and data-rich, which is ideal for sharing with clients or internal teams.
Wrapping up: turn your data into an always-on market analyst
Automating your real estate market trend reports with n8n, Cohere, Weaviate, and an LLM agent gives you a powerful edge. You save time, reduce errors, and scale your insights across multiple markets without adding more manual work.
If you are ready to stop wrestling with spreadsheets and start running a smart, repeatable data pipeline, this template is a great starting point.
Try the template by deploying the n8n workflow, connecting your data sources, and letting it generate your next report for you. If you need help tailoring it to your specific markets or integrating it with your CRM, you can reach out for a custom