Automated System Health Monitoring with n8n: Persist Reports to S3 and Notify via Slack
This article describes how to implement a robust, low-maintenance system health monitoring workflow in n8n that is suitable for production environments and self-hosted infrastructure. The workflow:
- Executes periodic health checks on a defined schedule
- Collects key system metrics and service status
- Stores complete JSON health snapshots in Amazon S3
- Sends structured Slack alerts for both normal and critical conditions
Use Case and Design Rationale
This pattern is well suited for small to mid-size teams, self-hosted clusters, and environments where you need:
- A transparent and auditable history of system health over time
- Fast, actionable alerts in Slack for operational incidents
- Cost-effective storage of detailed diagnostic data in S3
Instead of flooding Slack with verbose payloads, the workflow stores the full JSON snapshot in S3 and posts a concise Slack message that includes a summary plus a link to the full report. This separation keeps chat channels readable while providing rich data for forensic analysis, troubleshooting, and compliance audits.
Workflow Architecture Overview
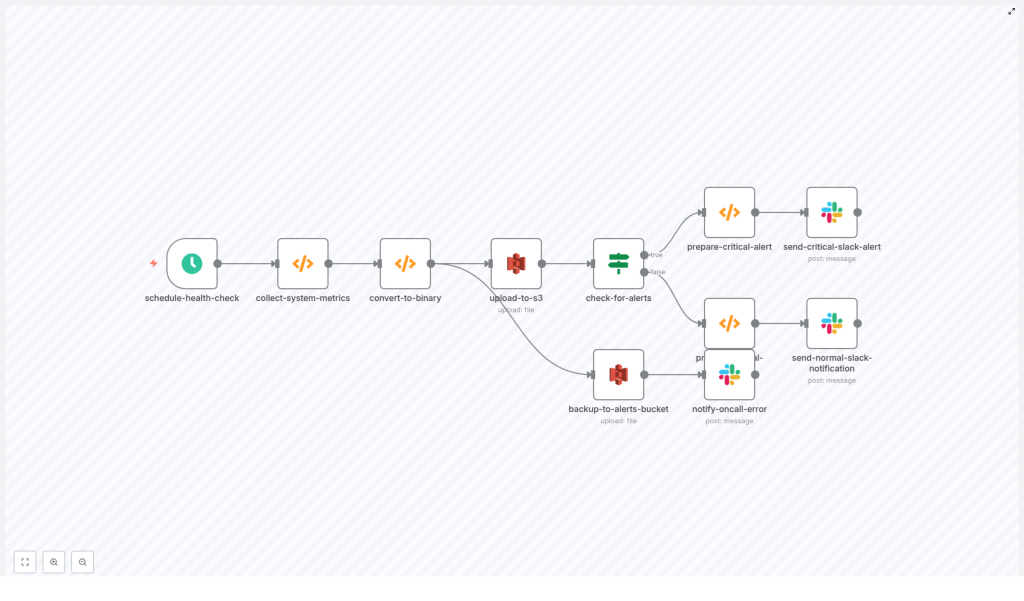
The n8n workflow follows a linear yet resilient pipeline that can be easily extended:
- Scheduled trigger initiates the health check at a fixed interval.
- Metric collection function gathers CPU, memory, disk, and service states.
- Conversion to binary prepares the JSON snapshot as a file-ready payload.
- S3 upload writes the snapshot to a designated S3 bucket with tags and timestamps.
- Alert evaluation inspects the snapshot for threshold breaches or failures.
- Slack notification sends either a critical or nominal status message.
- Error handling backs up problematic snapshots and alerts on-call if uploads fail.
The following sections detail each key node, integration, and best practice to make this workflow production ready.
Core n8n Nodes and Logic
1. Scheduled Health Check Trigger (schedule-health-check)
The workflow starts with a Schedule node configured to run every 5 minutes by default. This interval is configurable and should be tuned to your observability and cost requirements.
- Default frequency: every 5 minutes
- Considerations:
- Shorter intervals increase visibility but may raise S3 storage and Slack noise
- Longer intervals reduce cost but may delay detection of issues
- Coordinate with API rate limits if you integrate external services later
2. System Metric Collection Function (collect-system-metrics)
This Function node executes JavaScript (Node.js) to gather host and system information. It leverages the built-in os module to retrieve memory and host details. The template includes simulated CPU and disk metrics so that the workflow runs out of the box, and you can replace these with real measurements as you move to production.
Typical responsibilities of this node:
- Capture timestamp and hostname
- Read memory usage (total and free)
- Collect or simulate CPU and disk statistics
- Check service states (e.g. running, degraded, stopped)
- Evaluate thresholds and populate an
alertsarray when conditions are breached
// simplified example
const os = require('os');
const timestamp = new Date().toISOString();
const cpuUsage = /* sample or real measure */;
const memoryTotal = os.totalmem();
const memoryFree = os.freemem();

const healthData = {  timestamp,  hostname: os.hostname(),  metrics: {  // cpu, memory, disk, etc.  },  services: [  // { name: 'service-name', status: 'ok' | 'degraded' | 'down' }  ],  alerts: []
};

// threshold checks -> push to alerts
// e.g. if (cpuUsage > 0.9) healthData.alerts.push({ type: 'cpu', level: 'critical', value: cpuUsage });

return [{ json: healthData }];
In a production deployment, you may replace the simulated sections with:
- Shell commands via the Execute Command node (
top,df,vmstat,iostat) - Calls to a local agent or API endpoint that exposes metrics as JSON
- Integration with existing monitoring agents if they provide HTTP or CLI access
3. Binary Conversion for S3 Upload (convert-to-binary)
n8n represents file uploads as binary data. This Function node converts the JSON snapshot into a base64-encoded binary payload and sets the appropriate metadata:
- fileName: typically includes hostname and timestamp, for example
my-host_2024-01-01T10-00-00Z.json - mimeType:
application/json
The output of this node is a binary item that the S3 node can upload as a file object. Keeping the snapshot as pure JSON simplifies downstream processing and analysis.
4. Upload Snapshot to S3 (upload-to-s3)
The S3 node writes the binary snapshot to a designated bucket, for example system-health-snapshots. This bucket holds the full history of health checks.
Recommended configuration and practices:
- Bucket: a dedicated bucket for health snapshots, separated by environment if necessary
- Object key convention: include environment, hostname, and timestamp to support easy querying
- Tags: add tags such as
Environment=prod,Type=system-healthto enable lifecycle rules and cost analysis - IAM: use a least-privilege IAM user or role configured in n8n credentials with access only to the required buckets and prefixes
Storing snapshots in S3 provides durable, low-cost storage that can be integrated with downstream tooling such as Athena, Glue, or external analytics platforms.
5. Alert Evaluation Logic (check-for-alerts)
An If node inspects the alerts array produced by the metric collection function. It branches the workflow into two paths:
- Critical path: when one or more alerts exist, the workflow prepares a high-priority Slack message (for example with a red color indicator) and can route to incident channels or on-call rotations.
- Nominal path: when the system is healthy, it sends a green or informational message to a logging or observability channel, indicating that all systems are nominal.
This separation allows you to maintain a consistent audit trail while reserving attention-grabbing formatting for genuine incidents.
Designing Effective Slack Notifications
Slack messages should be concise, structured, and immediately actionable. The workflow typically constructs messages with the following elements:
- Title that includes hostname and timestamp
- One-line metrics summary (for example CPU, memory, and disk utilization)
- Service status overview (key services and their states)
- List of critical alerts if any thresholds are breached
- Direct link to the full JSON snapshot in S3 for deeper investigation
An example structure produced by the function that prepares the Slack payload might look like:
{  text: '🚨 Critical System Health Alert',  attachments: [  {  color: 'danger',  title: 'Health Check - my-host',  text: '*Metrics:* \nCPU: 92% ...',  footer: 'System Health Monitor'  }  ]
}
For normal states, you can adapt the same structure with a different color (for example good) and a message such as “All systems nominal”. Avoid including sensitive data directly in Slack and rely on S3 links for detailed payloads.
Storage Strategy, Retention, and Cost Optimization
Persisting every health check in S3 provides a valuable historical dataset, but it should be managed carefully to control costs.
- Lifecycle policies:
- Transition objects older than 30 to 90 days to Glacier or other archival tiers
- Optionally delete snapshots after a defined retention period if compliance allows
- Tagging:
- Use consistent tags for environment, system role, and data type
- Leverage tags for cost allocation and analytics
- Sampling strategy:
- Adjust check frequency to balance observability with storage overhead
- Consider lower frequency for non-critical systems and higher frequency for core infrastructure
Security and IAM Hardening
Since this workflow integrates with both AWS and Slack, security configuration is critical.
- IAM permissions:
- Create a dedicated IAM user or role for n8n
- Grant only the required S3 actions, such as
PutObjectandPutObjectTagging, scoped to the specific buckets and prefixes
- Credential management:
- Store AWS credentials and Slack tokens in the n8n credentials store
- Avoid embedding secrets directly in node parameters or code
- Network and bucket policies:
- Restrict S3 bucket policies to known VPC endpoints or IP ranges where feasible
- Ensure Slack tokens have only the scopes required for posting messages and not broader workspace access
Resilience, Error Handling, and Alert Hygiene
The template includes a dedicated error handling path that:
- Backs up problematic snapshots to a separate alerts bucket
- Notifies on-call personnel when S3 uploads fail or other critical errors occur
To further increase resilience and reduce noise, consider:
- Retries with backoff:
- Implement retry logic with exponential backoff for transient S3 or Slack failures
- Alert deduplication:
- Introduce logic to avoid sending repeated alerts for the same incident window
- For example, alert once per host and issue until the condition clears
- Rate limiting and aggregation:
- Aggregate multiple minor alerts into periodic summaries
- Apply rate limits to Slack notifications to prevent channel saturation
Customizing and Extending the Workflow
The provided template is a solid baseline and can be adapted to more advanced production scenarios.
- Real metrics instead of simulations:
- Use the Execute Command node to run
top,df,vmstat, or similar tools - Query a local or remote agent that exposes metrics as JSON
- Use the Execute Command node to run
- Incident management integration:
- Connect to PagerDuty, Opsgenie, or similar platforms for escalation workflows
- Trigger incidents only for critical alerts while keeping informational messages in Slack
- Metrics aggregation:
- Send key metrics to a time series database such as Prometheus or InfluxDB
- Use n8n primarily for snapshotting and alert fan-out while dashboards live in your TSDB or observability stack
- Historical analytics and dashboards:
- Query S3 snapshots with tools like Athena or feed events into an ELK stack
- Build dashboards that show alert frequency, host health trends, and capacity planning insights
Pre-Deployment Security Checklist
Before enabling the workflow in production, validate the following:
- IAM policies are restricted to the intended S3 buckets, prefixes, and actions only.
- No sensitive information (such as secrets, tokens, or PII) is included directly in Slack messages.
- Slack channel permissions are appropriate for the sensitivity of the health data.
- Slack tokens are scoped correctly and stored securely in n8n credentials.
Conclusion and Next Steps
This n8n workflow provides a lightweight yet powerful system health monitoring pipeline. It combines:
- Regular, automated health snapshots stored in S3 for long-term analysis
- Structured Slack notifications that enable rapid detection and remediation
- Extensibility for integration with incident management and observability platforms
To adopt this pattern in your environment:
- Clone the workflow into your n8n instance.
- Configure AWS and Slack credentials using the n8n credentials store.
- Adjust thresholds, check frequency, and S3 bucket names to match your infrastructure.
- Enable the schedule and validate behavior in a non-production environment before rollout.
If you want to refine alert deduplication, integrate real CPU and disk measurements, or connect to tools such as PagerDuty or Prometheus, you can iteratively extend the existing nodes or add new branches for those systems.