How a Tired Analyst Turned TV Ratings Chaos Into an Automated Trend Report With n8n & LangChain
The night everything broke
By the time Mia hit “send” on the last TV rating report of the day, it was already 11:42 p.m.
She stared at the spreadsheet on her screen, eyes blurring over columns of ratings, shares, timestamps, and notes from a dozen regions. Programming directors were waiting on her trend summary for the flagship show, Evening News, and she had just noticed a possible spike during a special election segment. To confirm it, she had to:
- Dig through old CSV files
- Search emails for past anomalies
- Manually copy-paste numbers into a Google Sheet
- Try to remember if they had seen something similar a few months ago
Every step was manual, slow, and fragile. One wrong paste or missed filter, and her report could be off. Worse, she knew that by the time she sent it, the data was already stale.
That night, after yet another last-minute request for “a quick week-over-week comparison,” Mia closed her laptop and thought, This has to be automated. There has to be a better way to build TV rating trend reports.
The search for a smarter TV rating workflow
The next morning, Mia wrote down what her ideal system would do. If she could redesign her workflow from scratch, it would:
- Ingest TV rating data in real time, without manual uploads
- Understand the meaning of notes and segments, not just numbers
- Find similar past events automatically, instead of forcing her to remember dates
- Summarize trends and anomalies in plain language
- Log everything neatly into Google Sheets for stakeholders
In other words, she wanted a pipeline that could turn raw TV rating events into actionable, contextual trend reports, with as little human effort as possible.
While researching workflow automation, she stumbled across an n8n workflow template titled “TV Rating Trend Report”, built with n8n + LangChain. The description sounded almost exactly like the system she had just described on paper.
Discovering the n8n TV rating trend report template
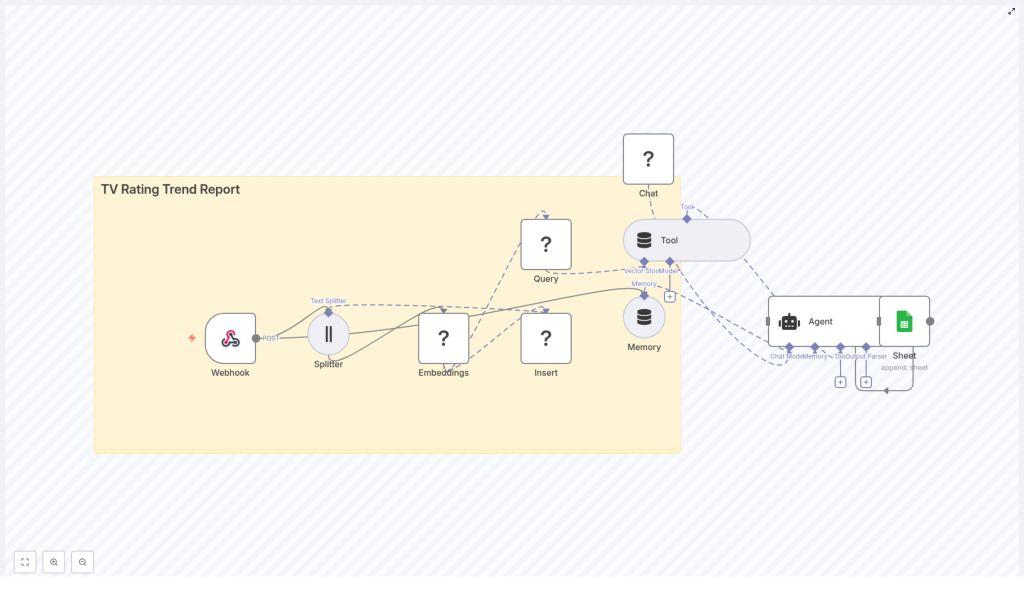
The template promised an automated pipeline that would:
- Use a webhook to ingest TV rating data in real time
- Split long notes into manageable chunks with a Text Splitter
- Create Hugging Face embeddings for semantic search
- Store vectors in a Redis vector store for similarity queries
- Use a memory buffer and LangChain-style agent to generate context-aware insights
- Automatically write final trend summaries to Google Sheets
It was not just a script. It was a full workflow that could take her from an incoming rating event to a structured, contextualized trend report, without manual intervention.
Mia decided to try it with a small pilot: one week of data for Evening News.
Rising action: wiring the pipeline together
Step 1: Giving the data somewhere to land – the webhook
The first thing Mia needed was a way to get her TV monitoring system to talk to n8n. The template started with a Webhook node, configured to accept POST requests.
She set up the webhook in n8n and pointed her rating system to send payloads like this:
{  "show": "Evening News",  "timestamp": "2025-09-25T20:00:00Z",  "rating": 3.8,  "share": 12.4,  "region": "Metro",  "notes": "Special segment on elections"
}
Now, every time a new rating event arrived, n8n would catch it instantly. No more CSV exports, no more drag-and-drop uploads.
Step 2: Teaching the system to read long notes
Mia knew that the real story often lived in the notes field. “Special segment on elections,” “guest appearance from celebrity anchor,” “breaking weather alert” – those were the details that explained spikes and dips.
The template used a Text Splitter node to handle long notes or combined reports. It was configured as a character-based splitter with:
chunkSize: 400chunkOverlap: 40
That meant if a note or narrative ran long, it would be broken into overlapping chunks of about 400 characters, with 40 characters of overlap to preserve context. For Mia’s medium-length notes, it was a sensible starting point.
She made a small mental note: if her notes ever got very short, she could reduce the overlap to save storage. And if she ever started sending structured JSON, she could serialize only the human-readable parts for embeddings.
Step 3: Turning words into vectors with Hugging Face embeddings
Next, the template attached an Embeddings node powered by Hugging Face. This was where the magic of semantic search began.
The node took each text chunk and converted it into a vector embedding, a numeric representation of meaning. With the right model, the system could later ask questions like “show me events similar to this spike” and retrieve relevant past episodes, even if the wording was different.
In the template, the model was set to default. Mia updated her n8n credentials to reference a specific Hugging Face model from the sentence-transformers family, which is commonly used for semantic search. That gave her more predictable quality and relevance.
Step 4: Storing history in Redis for similarity search
Embeddings were useful only if she could store and query them efficiently. The template used a Redis vector store, with an index called:
tv_rating_trend_report
Each time a new chunk arrived, the workflow would:
- Insert the vector into Redis
- Attach metadata such as show title, timestamp, rating, and region
This metadata was crucial. It meant Mia could later filter queries like:
- “Find similar events for this show in the last 7 days”
- “Retrieve anomalies for the Metro region only”
Her raw rating events were slowly turning into a searchable memory.
Step 5: Letting the agent look up context on demand
Once the data was flowing into Redis, Mia needed a way for the system to use it when generating reports. The template included a Query (Redis) node wrapped as a Tool.
When it was time to build a trend report, the agent could call this tool to:
- Fetch top-k similar chunks for a given show or time period
- Retrieve relevant past spikes, dips, or anomalies
Because the vector store was exposed as a tool, the agent could decide when to run a similarity search during its reasoning process. The logic stayed modular and transparent, and Mia could later inspect which context had been retrieved.
Step 6: Giving the workflow a memory and a voice
To make the analysis feel less like isolated snapshots and more like a continuous narrative, the template added two more pieces:
- A Memory (Buffer Window) node to keep recent interactions and summaries
- An Agent (LangChain-style) node connected to a chat model, the Tool, and the Memory
The memory buffer allowed the agent to remember what it had recently said about a show or a time period, instead of treating each report as a blank slate. The agent could then synthesize:
- Week-over-week changes
- Notable spikes and dips
- Context-aware commentary that referenced past events
Mia shaped the agent prompt using a simple pattern. She made sure it always received:
- The retrieval results (most similar chunks from Redis)
- Current metrics like rating and share
- Relevant memory or conversation context
Her prompt looked similar to this:
Analyze the current rating data and the retrieved historical context. Provide a one-paragraph trend summary and list any significant anomalies with probable causes.
It was concise, but clear about expectations: a short trend summary plus a list of anomalies and likely explanations.
Step 7: Sending everything where stakeholders actually live – Google Sheets
Finally, the agent needed somewhere to write its findings. Mia’s team relied heavily on a shared Google Sheet, where programming directors checked daily performance.
The workflow ended with a Google Sheets node that appended a new row to a sheet named Log. The agent was configured to output a structured set of fields, which mapped to columns like:
dateshowaggregated_ratingtrend_summarynoteslink_to_record
For a payload like this:
{  "show": "Evening News",  "timestamp": "2025-09-25T20:00:00Z",  "rating": 3.8,  "share": 12.4,  "region": "Metro",  "notes": "Special segment on elections; high engagement on social"
}
She expected to see a row similar to:
[2025-09-25, Evening News, 3.8, +0.4 (wk), "Spike during special segment; similar to 2025-06-12 episode", link_to_record]
For the first time, the spreadsheet would update itself with both numbers and narrative.
The turning point: from manual grind to automated insight
A few days into her pilot, Mia watched the workflow run on a real spike.
There had been a special segment on elections during Evening News. Ratings ticked up, social engagement surged, and the monitoring system fired its usual payload into n8n.
Behind the scenes, the data flowed:
- The Webhook caught the POST request.
- The Text Splitter chunked the notes, using
chunkSize=400andchunkOverlap=40. - The Embeddings (Hugging Face) node turned chunks into vectors.
- The Insert (Redis Vector Store) node stored them with metadata under
tv_rating_trend_report. - When it was time to generate the report, the Query (Redis) + Tool retrieved similar past events.
- The Memory (Buffer Window) added recent context.
- The Agent pulled everything together into a trend summary.
- The Google Sheets node appended the final report to the
Logsheet.
By the time Mia opened the Google Sheet, the row was already there. The trend summary mentioned a spike similar to one during a past election episode, highlighted the week-over-week increase, and pointed to likely causes.
There were no frantic searches through old files, no late-night spreadsheet edits, and no guesswork about whether a spike was truly unusual.
Behind the scenes: tuning and best practices Mia learned
Choosing the right embedding model
Mia noticed early on that the quality of semantic search depended heavily on the embedding model. For broadcast text and short notes, she found that models from the sentence-transformers family, or other models optimized for semantic search, delivered more relevant similarity results than generic models.
By explicitly setting a model in her Hugging Face credentials instead of relying on the default, she kept the quality consistent across runs.
Adjusting chunk size and overlap
The default chunkSize=400 with chunkOverlap=40 worked well at first, but Mia experimented:
- When she saw some loss of context between chunks, she tried increasing overlap slightly.
- When storage costs grew due to very frequent events, she considered reducing chunk size or filtering out low-value notes.
She kept the rule simple: if the agent seemed to miss important context, increase overlap. If the vector store grew too large or expensive, reduce chunk size or be selective about what got embedded.
Making metadata do the heavy lifting
Early on, Mia realized that good metadata was not optional. Every vector insert into Redis included:
showregionratingtimestamp
With those fields, she could run filtered queries like “same show, last 7 days” or “same region, similar notes.” Retrieval quality improved dramatically once she combined vector similarity with basic metadata filters.
Keeping credentials safe
Mia also took care to secure her integrations. Inside n8n, she stored:
- Hugging Face API keys
- Redis credentials
- Google Sheets OAuth tokens
All were kept in n8n’s credentials manager, with least-privilege access and periodic key rotation. It was a small step that avoided big security headaches later.
Building resilience with error handling and monitoring
As the workflow moved toward production, Mia added guardrails:
- Retry logic for transient network issues and rate limits
- Error handlers for failed Google Sheets appends
- Monitoring for webhook latency and queue sizes
If a single step failed, the entire reporting process would not silently break. She could see what went wrong and fix it quickly.
Scaling up: from one show to the entire schedule
Once the pilot for Evening News ran smoothly, Mia expanded the workflow to cover more shows. As volumes increased, she learned a few tricks to control cost and keep performance stable.
Handling large volumes of rating events
For high-traffic schedules, Mia:
- Used batch inserts into Redis instead of writing every event individually
- Applied a cheaper embedding model for routine data, reserving a higher-quality model for anomalies or priority shows
- Periodically archived or downsampled old vectors, especially for periods where fine-grained history was less critical
The result was a scalable vector store that did not balloon uncontrollably.
Real-world ways Mia used the workflow
Over the next few weeks, the “TV Rating Trend Report” workflow became part of Mia’s daily toolbox. Some practical use cases emerged:
- Daily trend summaries automatically written to a Google Sheet and emailed to programming directors
- Alerting logic when a show’s rating jumped by more than a set percentage week over week
- Semantic search across past episodes to find similar spikes or dips for editorial analysis
- Stakeholder-facing logs that updated themselves, with both numbers and narrative
What used to be late-night manual work turned into a mostly hands-off system that surfaced insights on its own.
Troubleshooting: the bumps along the way
Not everything worked perfectly from day one. Mia ran into a few issues and learned how to fix them:
- Irrelevant retrieval results
She checked whether metadata filters were set correctly and whether her embedding model was a good fit for short broadcast notes. Adjusting filters and upgrading the model improved relevance. - Agent hallucinations
When the agent occasionally inferred events that did not happen, she increased the