Build an Environmental Data Dashboard with n8n, Weaviate, and OpenAI
Imagine this: your sensors are sending environmental data every few seconds, your inbox is full of CSV exports, and your brain is quietly screaming, “There has to be a better way.” If you have ever copy-pasted readings into spreadsheets, tried to search through old reports, or manually explained the same anomaly to three different stakeholders, this guide is for you.
In this walkthrough, you will learn how to use an n8n workflow template to build a scalable Environmental Data Dashboard that actually works for you, not the other way around. With n8n handling orchestration, OpenAI taking care of embeddings and language tasks, and Weaviate acting as your vector database, you get a searchable, conversational, and memory-enabled dashboard without writing a giant backend service.
The workflow automatically ingests environmental readings, splits and embeds text, stores semantic vectors, finds similar records, and logs everything neatly to Google Sheets. In other words: fewer repetitive tasks, more time to actually interpret what is going on with your air, water, or whatever else you are monitoring.
What this n8n template actually does
At a high level, this Environmental Data Dashboard template turns raw telemetry into something you can search, ask questions about, and audit. It combines no-code automation with AI so you can build a smart dashboard without reinventing the wheel.
Key benefits of this architecture
- Real-time ingestion via webhooks – sensors, IoT gateways, or scripts send data directly into n8n as it happens.
- Semantic search with embeddings and Weaviate – instead of keyword matching, you search by meaning using a vector database.
- Conversational access via an LLM Agent – ask natural language questions and get context-rich answers.
- Simple logging in Google Sheets – keep a clear audit trail without building a custom logging system.
All of this is stitched together with an n8n workflow that acts as the control center for your Environmental Data Dashboard.
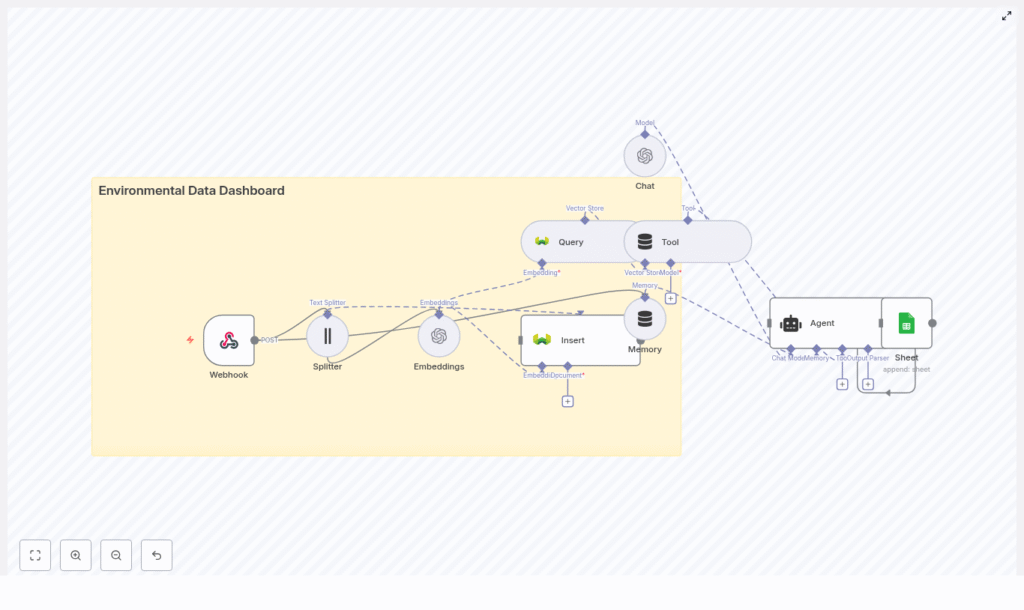
How the n8n workflow is wired together
The template uses a series of n8n nodes that each play a specific role. Instead of one massive block of code, you get a modular pipeline that is easy to understand and tweak.
- Webhook – receives incoming POST requests with environmental data.
- Splitter – breaks long text payloads into chunks using a character-based splitter.
- Embeddings – uses OpenAI to convert each chunk into an embedding vector.
- Insert – stores embeddings plus metadata in a Weaviate index named
environmental_data_dashboard. - Query and Tool – search the vector store for similar records and expose that capability to the Agent.
- Memory – keeps recent conversation context so the Agent can handle follow-up questions.
- Chat – an OpenAI chat model that generates human-readable answers.
- Agent – orchestrates tools, memory, and chat to decide what to do and how to respond.
- Sheet – appends logs and results to a Google Sheet for auditing.
Once set up, the workflow becomes your automated assistant for environmental telemetry: it remembers, searches, explains, and logs, without complaining about repetitive tasks.
Quick-start setup guide
Let us walk through the setup in a practical way so you can go from “idea” to “working dashboard” without getting lost in the details.
1. Capture data with a Webhook
Start with a Webhook node in n8n. Configure it like this:
- HTTP Method:
POST - Path: something like
/environmental_data_dashboard
This endpoint will receive JSON payloads from your sensors, IoT gateways, or scheduled scripts. Think of it as the front door to your Environmental Data Dashboard.
2. Split incoming text into digestible chunks
Long reports or verbose telemetry logs are great for humans, less great for embedding models if you throw them in all at once. Use the Splitter node to chunk the text with these recommended settings:
chunkSize: 400
chunkOverlap: 40
This character-based splitter keeps semantic units intact while avoiding truncation. In other words, your model does not get overwhelmed, and you do not lose important context.
3. Generate OpenAI embeddings
Connect the Splitter output to an Embeddings node that uses OpenAI. Configure it by:
- Choosing your preferred embedding model or leaving it as
defaultif you rely on n8n’s abstraction. - Setting up your OpenAI API credentials in n8n credentials (never in plain text on the node).
Each chunk is turned into an embedding vector, which is basically a numerical representation of meaning. These vectors are what make semantic search possible.
4. Store vectors in Weaviate
Next, use an Insert node to send those embeddings to Weaviate. Configure it with:
- indexName:
environmental_data_dashboard
Along with each embedding, include useful metadata so your search results are actionable. Common fields include:
timestampsensor_idlocationpollutant_typeorsensor_typeraw_textor original payload
This combination of embeddings plus metadata is what turns a vector store into a practical environmental data dashboard.
5. Query the vector store for context
When the Agent needs context or you want to detect anomalies, use the Query node to search Weaviate for similar embeddings. Then connect that to a Tool node so the Agent can call it programmatically.
This lets the system do things like:
- Find historical events similar to a new spike.
- Pull related records when a user asks “What caused the air quality drop on July 12?”.
6. Add conversational memory
To keep your Agent from forgetting everything between questions, add a Memory node using a buffer window. This stores recent conversation context.
It is especially useful when users ask follow-up questions such as, “How has PM2.5 trended this week in Zone A?” and expect the system to remember what you were just talking about.
7. Combine Chat model and Agent logic
The Agent node is where the magic orchestration happens. It connects:
- The Chat node (OpenAI chat model) for natural language reasoning and responses.
- The Memory node to keep context.
- The Tool node that queries Weaviate.
Configure the Agent prompt and behavior so it can:
- Decide when to call the vector store for extra context.
- Generate clear, human-readable answers.
- Expose any relevant details for logging to Google Sheets.
8. Log everything to Google Sheets
Finally, use a Sheet node to append logs or results to a Google Sheet. Configure it roughly like this:
- Operation:
append - sheetName:
Log
Capture fields such as:
timestampquery_textagent_responsevector_matchesraw_payload
This gives you an instant audit trail without having to build a custom logging system. No more mystery decisions from your AI Agent.
Security, credentials, and staying out of trouble
Even though automation is fun, you still want to avoid accidentally exposing data or keys. Keep things safe with a few best practices:
- Store API keys in n8n credentials, not in node-level plain text.
- Use HTTPS for webhook endpoints and validate payloads with HMAC or API keys to prevent spoofed submissions.
- Restrict access to Weaviate using VPC, API keys, or authentication and tag vectors with dataset or tenant identifiers for multi-tenant setups.
- Apply rate limiting and batching to keep embedding costs under control, especially for high-frequency sensor networks.
Optimization tips for a smoother dashboard
Control embedding costs with batching
Embeddings are powerful but can get pricey if you are embedding every tiny reading individually. To optimize:
- Buffer events for a short period, such as a minute, and embed in batches.
- Tune
chunkSizeandchunkOverlapto reduce the number of chunks while preserving meaning.
Improve search relevance with better metadata
If search results feel a bit vague, enrich your vectors with structured metadata. Useful fields include:
locationtimestampsensor_typeseverity
Then, when querying Weaviate, use filtered searches to narrow down results based on these fields instead of scanning everything.
Plan for long-term storage
For long-running projects, you likely do not want to keep every raw reading in your primary vector store. A good pattern is:
- Store raw data in cold storage such as S3 or Blob storage.
- Keep summaries or embeddings in Weaviate for fast semantic search.
- Track the embedding model version in metadata so you can re-generate embeddings if you change models later.
Common ways to use this Environmental Data Dashboard
Once this n8n workflow is live, you can use it for more than just passive monitoring. Some popular use cases include:
- Search historical reports for similar anomalies when something unusual happens.
- Ask natural language questions like “What caused the air quality drop on July 12?” and have the Agent respond with context and supporting records.
- Real-time alerts where new telemetry embeddings that differ from normal clusters trigger Slack or email alerts.
Template configuration reference
Here is a quick reference of the important node parameters used in the template, so you do not have to hunt through each node manually:
- Webhook:
path = environmental_data_dashboard,HTTP method = POST - Splitter:
chunkSize = 400,chunkOverlap = 40 - Embeddings:
model = default(OpenAI API credentials configured in n8n) - Insert / Query:
indexName = environmental_data_dashboardin Weaviate - Sheet:
Operation = append,sheetName = Log
Example webhook payload
To test your webhook or integrate a sensor, you can send a JSON payload like this:
{  "sensor_id": "zone-a-01",  "timestamp": "2025-08-01T12:34:56Z",  "location": "Zone A",  "type": "PM2.5",  "value": 78.4,  "notes": "Higher than usual, wind from north"
}
This kind of payload will flow through the entire pipeline: webhook, splitter, embeddings, Weaviate, Agent, and logging.
Where to go from here
With this Environmental Data Dashboard template, you get a ready-made foundation to capture, semantically index, and interact with environmental telemetry. No more manually scanning spreadsheets or digging through logs by hand.
From here you can:
- Add alerting channels like Slack or SMS for real-time notifications.
- Build a UI that queries the Agent or vector store to generate charts and trend summaries.
- Integrate additional tools, such as time-series databases, for deeper analytics.
To get started, import the n8n workflow template, plug in your OpenAI and Weaviate credentials, and point your sensors at the webhook path. In just a few minutes, you can have a searchable, conversational Environmental Data Dashboard running.
Call to action: Try the template, fork it for your specific use case, and share your feedback. If you need help adapting the pipeline for high-frequency IoT data or complex deployments, reach out to our team for consulting or a custom integration.