Energy Consumption Anomaly Detector with n8n: Turn Your Data Into Insight
Every unexpected spike in energy usage, every quiet dip in consumption, is a story waiting to be told. For utilities, facility managers, and IoT operators, those stories are often buried in endless time-series data and noisy dashboards.
If you have ever felt overwhelmed by manual monitoring, rigid rules, and false alarms, you are not alone. The good news is that you can turn this chaos into clarity with automation that actually understands your data.
This guide walks you through an n8n workflow template that uses Hugging Face embeddings and Supabase vector storage to detect anomalies in energy consumption. More than just a technical setup, it is a stepping stone toward a more automated, focused, and proactive way of working.
From Manual Monitoring To Intelligent Automation
Traditional rule-based systems often feel like a game of whack-a-mole. You set thresholds, tweak rules, and still miss subtle issues or drown in false positives. As your infrastructure grows, this approach becomes harder to maintain and even harder to trust.
Instead of asking you to manually define every possible pattern, vector embeddings and semantic similarity let your system learn what “normal” looks like and spot what does not fit. It is a shift in mindset:
- From rigid rules to flexible patterns
- From endless tuning to data-driven thresholds
- From reactive firefighting to proactive detection
With n8n as your automation layer, you can orchestrate this entire flow, connect it to your existing tools, and keep improving it as your needs evolve.
Why Vector Embeddings Are Powerful For Anomaly Detection
Energy data is often time-series based, noisy, and full of seasonal or contextual patterns. Trying to capture all of that with static rules is exhausting. Embeddings offer a more natural way to represent this complexity.
By converting consumption windows into vectors, you can:
- Compare new data to historical patterns with fast similarity search
- Detect unusual behavior that does not match past usage, even if it is subtle
- Adapt your detection logic without rewriting dozens of rules
In this workflow, you store historical consumption chunks as embeddings in a Supabase vector store. Each new window of readings is transformed into a vector, then compared to its nearest neighbors. When similarity drops or patterns shift, you can flag anomalies, log them, and trigger actions automatically.
Mindset Shift: Think In Windows, Not Individual Points
Instead of inspecting single readings, this n8n template encourages you to think in terms of “windows” of time. Each window captures a slice of behavior, such as 60 minutes of power usage, and turns it into a semantically rich representation.
This mindset unlocks:
- Context-aware detection, where patterns across time matter more than isolated values
- Smoother anomaly scores, less noise, and more meaningful alerts
- A scalable path to add more features, such as seasonal comparison or multi-device analysis
You are not just setting up a one-off workflow. You are building a foundation you can extend as your automation strategy grows.
The Architecture: Your Automation Stack At A Glance
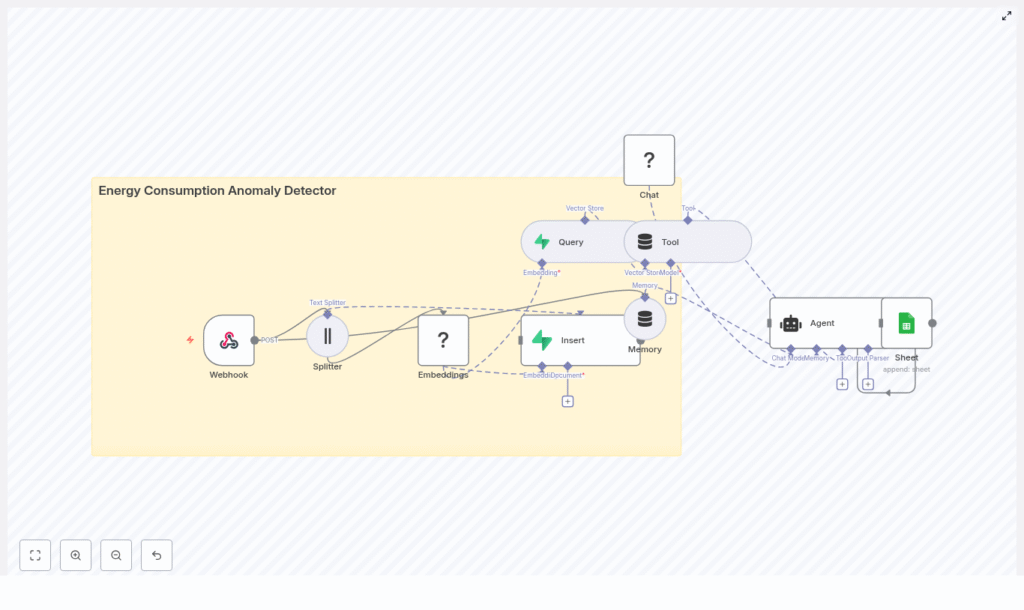
The Energy Consumption Anomaly Detector n8n template brings together several components into a cohesive, production-ready pipeline:
- Webhook – Receives incoming energy consumption payloads from meters, gateways, or batch jobs.
- Splitter – Breaks long inputs (CSV or JSON time-series) into overlapping windows for embedding.
- Hugging Face Embeddings – Converts each window into a vector representation.
- Supabase Vector Store – Stores vectors along with metadata such as timestamps and device IDs.
- Query / Tool Node – Finds nearest neighbors and provides data for anomaly scoring.
- Memory & Agent – Adds context, generates human-readable explanations, and automates decisions.
- Google Sheets – Optionally logs anomalies and decisions for review, auditing, or retraining.
Each piece is modular, so you can start simple and then refine, expand, or swap components as your system matures.
How A Single Payload Flows Through The Workflow
Picture a new batch of readings arriving from one of your meters. Here is how the n8n template processes it, step by step, turning raw numbers into actionable insight.
- Receive data via Webhook
The Webhook node accepts POST requests that include:device_id- Timestamped
readings - Optional
metadatasuch as location
- Chunk readings into windows
The Splitter node creates rolling windows from your time-series. In the template:chunkSize = 400chunkOverlap = 40
This overlap preserves continuity and helps the embeddings capture transitions smoothly.
- Generate embeddings with Hugging Face
Each chunk is passed to the Hugging Face Embeddings node, which converts the window into a vector. This vector encodes the shape and behavior of the consumption pattern, not just raw numbers. - Insert vectors into Supabase
The embeddings, along with metadata, are stored in the Supabase vector index:indexName = energy_consumption_anomaly_detector
Over time, this builds a rich historical representation of how each device behaves.
- Query neighbors and detect anomalies
When new data arrives, the workflow:- Queries nearest neighbors from the vector store
- Feeds results into the Agent node
- Applies anomaly logic and logs outcomes, for example in Google Sheets or another sink
The result is a loop that learns from your historical data and continuously evaluates new behavior, all orchestrated through n8n.
Smart Strategies For Anomaly Detection With Vectors
Once your data is represented as vectors, you can combine several strategies to build robust anomaly scores. This is where your creativity and domain knowledge really matter.
- Nearest neighbor distance
Measure how far a new window is from its k-nearest historical neighbors. If the average distance exceeds a threshold, flag it as an anomaly. - Local density
Look at how densely the vector space is populated around the new point. Sparse regions often indicate unfamiliar patterns. - Temporal drift
Compare the new window not only to recent data, but also to past windows from the same hour or day. This helps reveal seasonal or schedule-related deviations. - Hybrid ML scoring
Combine vector-based distance with a simple model such as an isolation forest or autoencoder on numeric features. This can strengthen your detection pipeline.
Recommended Anomaly Scoring Formula
A practical starting point for an anomaly score S is:
S = alpha * normalized_distance + beta * (1 - local_density) + gamma * temporal_deviation
You can tune alpha, beta, and gamma on a validation set, ideally using historical labeled anomalies. This tuning phase is where your workflow evolves from “working” to “highly effective.”
What To Store: Data And Metadata That Unlock Insight
The quality of your anomaly detection is tightly linked to what you store alongside each embedding. In Supabase, include metadata that makes filtering and interpretation easy and fast.
Recommended fields:
- device_id or meter_id for identifying the source
- start_timestamp and end_timestamp for each chunk
- Summary statistics such as mean, median, min, max, variance
- Raw chunk hash or link to retrieve full series when needed
- Label (optional) for supervised evaluation or manual tagging
These details make it easier to slice data by device, time window, or conditions and to debug or refine your detection logic.
Example Webhook Payload
Here is a sample payload your Webhook node might receive:
{  "device_id": "meter-01",  "readings": [  {"ts":"2025-08-31T09:00:00Z","value":12.4},  {"ts":"2025-08-31T09:01:00Z","value":12.7},  ...  ],  "metadata": {"location":"Building A"}
}
You can adapt the schema to your environment, but keep the essentials: device identifier, timestamped readings, and optional metadata.
Configuring Your n8n Nodes For Success
The template gives you a solid starting point, and a few configuration choices will help you tailor it to your environment and scale.
- Webhook
Set a clear path, for exampleenergy_consumption_anomaly_detector, and secure it with a secret token in headers. - Splitter
AlignchunkSizeandchunkOverlapwith your data cadence. The default 400 points with 40 overlap works well for dense streams, but you can adjust based on your sampling rate. - Embeddings (Hugging Face)
Choose a model suitable for numerical sequences or short time-series. Store your API credentials in the n8n credentials manager to keep everything secure and reusable. - Supabase Vector Store Insert
Use the index nameenergy_consumption_anomaly_detectorand include metadata fields. This enables filtered similarity search by device, time window, or other attributes. - Query Node
Start withk = 10nearest neighbors. Compute distances and feed them into your anomaly score calculation. - Agent Node
Use the agent to:- Generate human-friendly explanations of each anomaly
- Decide whether to notify operations or escalate
- Append logs or comments for future analysis
- Logging (Google Sheets or similar)
Log anomalies, scores, decisions, and context. This creates a valuable dataset for retraining, threshold tuning, and audits.
Evaluating And Improving Your Detector Over Time
Automation is not a one-time project. It is a continuous journey. To keep improving your anomaly detector, monitor both detection quality and operational performance.
Key metrics to track:
- True positive rate (TPR) and false positive rate (FPR) on labeled incidents
- Time-to-detect – how long it takes from event occurrence to anomaly flag
- Operational metrics such as:
- API request latencies
- Vector store query times
- Embedding costs for Hugging Face models
Run periodic backtests by replaying historical windows through the workflow. Use maintenance logs and incident reports as ground truth to tune your alpha, beta, and gamma coefficients in the scoring formula.
Security, Privacy, And Cost: Building Responsibly
As you scale automation, staying mindful of security and cost is essential. This template is designed with those concerns in mind, and you can extend it with your own policies.
- Security & privacy
- Encrypt personally identifiable information (PII)
- Restrict access to the Supabase database
- Store only aggregated summaries in the vector store if raw data is sensitive
- Cost management
- Rate-limit webhook and embedding calls to control external API costs
- Monitor usage and set budgets for vector storage and model calls
With these safeguards in place, you can scale confidently without surprises.
Scaling Your Workflow To Production
Once the template is running smoothly on a small subset of devices, you can gradually scale it to cover more sources and higher volumes.
- Batch embeddings for multiple chunks to reduce API overhead and improve throughput.
- Shard vector stores by region or device class to lower latency and simplify scaling.
- Use asynchronous alert channels such as queues or pub/sub when many anomalies may trigger at once.
- Persist raw time-series in a dedicated time-series database (InfluxDB, TimescaleDB) while keeping the vector store lean and focused on embeddings.
This approach lets you grow from a proof-of-concept to a production-grade anomaly detection system without rewriting your entire stack.
A Real-World Example: From Anomaly To Action
Imagine a manufacturing plant streaming minute-level power readings from a key device. A 60-minute window is created, chunked, and embedded using the workflow.
The new window’s vector is compared against its ten nearest historical neighbors. The average distance turns out to be three times the historical mean distance for that device and hour. The Agent node recognizes this as unusual, marks the window as anomalous, and writes a detailed entry to Google Sheets.
The log includes:
device_id- Relevant timestamps
- Anomaly score and contributing factors
- Suggested next steps, such as inspecting HVAC or checking recent maintenance
The operations team receives an alert, investigates, and resolves the root cause faster than they could have with manual monitoring alone. Over time, these small wins compound into significant savings and more reliable operations.
Taking The Next Step: Make This Template Your Own
This n8n workflow is more than a template. It is a starting point for a more automated, insight-driven way of managing energy consumption. You can begin with the default configuration, then iterate as you learn from your data.
To get started:
- Import the Energy Consumption Anomaly Detector template into your n8n instance.
- Configure your Hugging Face and Supabase credentials in the n8n credentials manager.
- Adjust
chunkSize, thresholds, and neighbor counts to match your data cadence and noise level.
As you gain confidence, experiment with new scoring strategies, additional metadata, or different notification channels. Each adjustment is a step toward an automation system that reflects your unique environment and goals.
If you need help tailoring the pipeline to your setup, you can reach out for implementation support or request a walkthrough. You do not have to build everything alone.
Ready to deploy? Export the workflow, plug in your credentials, and run a few historical replays. Validate the detector, refine your thresholds, and when you are comfortable, route alerts to your operations team.