Generate Actionable Survey Insights with n8n, Qdrant & OpenAI
Survey data is valuable, but manually reading hundreds or thousands of responses can be slow and inconsistent. This n8n workflow template shows you how to turn raw survey answers into clear, auditable insights using:
- OpenAI embeddings
- Qdrant as a vector database
- K-means clustering to group similar answers
- An LLM summarizer to generate insights and sentiment
You keep full traceability, including participant IDs, answer counts, and raw responses, so you can always see how each insight was produced.
What you will learn
By the end of this guide, you will understand how to:
- Prepare survey responses in n8n as question-answer pairs with metadata
- Generate OpenAI embeddings and store them in Qdrant for fast, flexible querying
- Run K-means clustering on similar answers to each question
- Use an LLM to summarize clusters into clear insights with sentiment labels
- Export all results back into Google Sheets for review and reporting
- Tune and troubleshoot the workflow for large surveys and better quality outputs
Core idea: why this n8n survey workflow works
Simply pasting all responses into a single LLM prompt can give you a quick summary, but you lose:
- Nuance between different types of answers
- Visibility into how many people share each opinion
- Traceability back to specific participants and their responses
This workflow solves those problems by:
- Vectorizing each individual answer with OpenAI embeddings so semantic similarity is measured accurately.
- Storing embeddings in Qdrant along with metadata such as question text, participant ID, and survey name.
- Clustering similar answers with K-means, then summarizing each cluster separately using an LLM.
- Exporting structured insights to Google Sheets (or another datastore) with counts, IDs, and raw answers for auditability.
The result is an automated pipeline that is repeatable, transparent, and easy to adapt for new surveys.
Key concepts before you start
Embeddings and vectorization
An embedding is a numeric representation of text. Similar texts have similar vectors. In this workflow:
- Each survey answer is converted into an embedding using an OpenAI model, such as
text-embedding-3-small. - These vectors are stored in Qdrant so that similar answers can be compared and grouped.
Qdrant as a vector store
Qdrant is a vector database. It stores:
- The embedding vector for each answer
- Metadata such as the question text, participant ID, and survey name
By filtering on metadata (for example, metadata.question == currentQuestion), you can retrieve only the answers relevant to one specific question.
K-means clustering
K-means is a clustering algorithm that groups similar points (here, answer vectors) into a fixed number of clusters. In this template:
- A Python-based node runs K-means on the embeddings for one question.
- You set a maximum number of clusters (for example, up to 10).
- Each cluster represents a common theme or viewpoint among the answers.
LLM summarization and insight generation
Once you have clusters of similar answers, an LLM is used to:
- Summarize the responses in a short paragraph
- Explain the key insight or takeaway from that cluster
- Assign a sentiment label such as negative, mildly negative, neutral, mildly positive, or positive
This is handled inside an Information Extractor style node (or equivalent LLM node) in n8n.
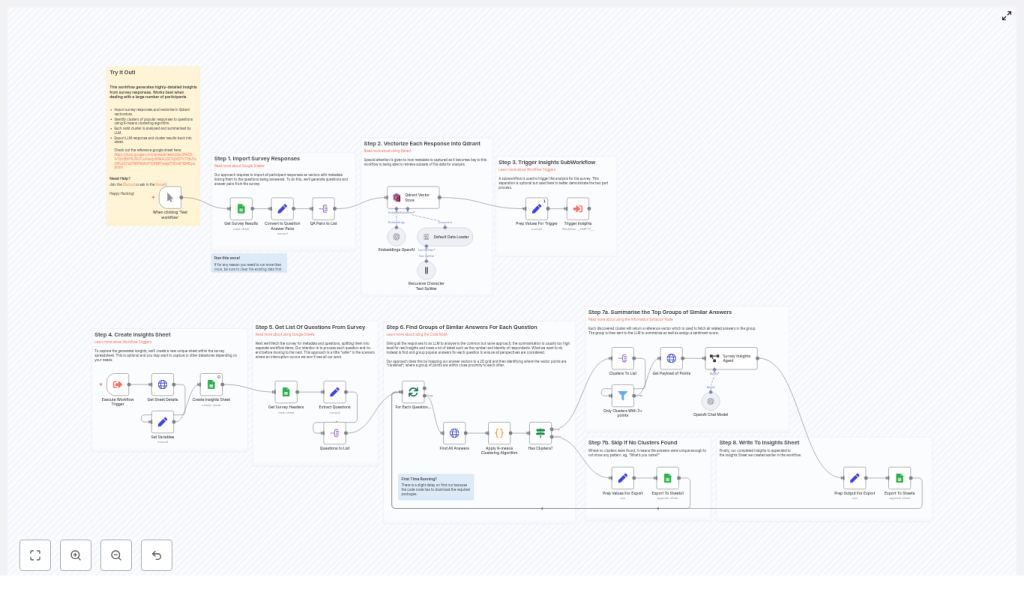
Step-by-step: how the n8n survey analysis workflow works
Step 1 – Import survey responses from Google Sheets
The workflow begins by reading your survey data from Google Sheets:
- Each row in the sheet represents one participant.
- Each column represents either a question or an identifier (for example, participant ID).
n8n converts each row into a structure that includes the participant ID and all their answers. This sets the stage for turning each answer into a standalone item later.
Step 2 – Convert rows into question-answer pairs
A transform node (for example, a Function or Item Lists node) maps the sheet columns into a standard format such as:
{ question, answer, participant }
This step is important because:
- Each answer becomes an independent item to be embedded.
- Metadata like
participantandsurveycan be attached consistently. - Downstream nodes can process all answers in the same way, regardless of the original column layout.
Step 3 – Generate embeddings and insert into Qdrant
For every question-answer pair:
- The answer text is sent to the OpenAI embedding model, for example
text-embedding-3-small. - The resulting vector is stored in Qdrant with metadata fields such as:
question– the exact question textparticipant– participant ID or identifiersurvey– survey name or ID
This design makes it easy to later query Qdrant for all answers to one specific question, or to filter by survey or participant if needed.
Step 4 – Separate ingestion from analysis with a subworkflow
To keep the system robust, the template splits the process into two parts:
- Ingestion workflow – reads from Google Sheets, creates embeddings, and writes to Qdrant.
- Insights subworkflow – performs clustering and summarization on top of the stored data.
The main workflow triggers the insights subworkflow once ingestion is complete. If the analysis fails or needs to be re-run, you do not lose the ingested data in Qdrant.
Step 5 – Create a dedicated Insights sheet
Before processing questions, the analysis workflow creates a new sheet inside the same Google spreadsheet. Typical behavior:
- The sheet name includes a timestamp so you can track when the analysis was run.
- All generated insights are appended to this sheet.
This gives you a clean, separate output space for reporting and sharing.
Step 6 – Detect question columns and loop through questions
The workflow examines the headers of your original Google Sheet to identify which columns are questions. A common pattern is:
- Look for header text that contains a question mark.
- Ignore ID or metadata columns that are not survey questions.
For each detected question, n8n runs the full analysis pipeline:
- Fetch embeddings for that question from Qdrant.
- Cluster those embeddings.
- Filter and summarize clusters.
- Write the resulting insights to the Insights sheet.
Step 7 – Retrieve embeddings and run K-means clustering
For a single question:
- The workflow queries Qdrant for all vectors where
metadata.questionequals the current question text. - The resulting vectors are passed to a K-means implementation in a Python node (or similar custom code node).
- You configure:
- Max number of clusters, for example up to 10.
- Other K-means parameters as needed.
Each cluster groups answers that are semantically similar, such as people who all mention “flexibility” or “work-life balance” in a remote work survey.
Step 8 – Filter clusters and summarize with an LLM
Not all clusters are useful. Some may contain only one or two answers. To avoid noisy insights:
- The workflow filters out clusters that have fewer than a minimum number of points. The template uses a default minimum cluster size of 3.
For each remaining cluster:
- The workflow fetches all associated payloads, including:
- Answer text
- Participant IDs
- These are sent to an information extractor node that uses an LLM to:
- Summarize the grouped responses in a short paragraph.
- Generate a clear insight that explains what these answers tell you.
- Assign a sentiment label such as:
- negative
- mildly negative
- neutral
- mildly positive
- positive
Step 9 – Export insights back to Google Sheets
Before writing to the Insights sheet, each cluster-level insight is enriched with extra fields so you can audit and analyze it later. Typical fields include:
- Question – the original survey question text
- Insight summary – the LLM generated explanation
- Sentiment – one of the predefined labels
- Number of responses in the cluster
- Participant IDs – usually stored as a comma-separated list
- Raw responses – the original text answers used to generate the insight
Each insight is appended as a new row in the Insights sheet created earlier.
Example of a generated insight
Here is a sample output for a question about remote work:
<Question>: What do you enjoy most about working remotely?
<Insight>: Most participants value flexibility and fewer commute hours. Several respondents mentioned improved work-life balance and the ability to structure the day around personal commitments.
<Sentiment>: Positive
<Number of Responses>: 42
<Participant IDs>: 2,7,9,14,31,...
From a single cluster, you can immediately see:
- What people are saying
- How they feel about it
- How many participants share that view
- Which specific participants are included, if you need to investigate further
Configuration tips and best practices
Choosing an embedding model
text-embedding-3-smallis a good default. It balances cost and quality for most survey analysis use cases.- If you need higher semantic accuracy and can accept higher cost, consider
text-embedding-3-large.
Setting the number of clusters
The K-means node uses a maximum cluster count, with the template defaulting to around 10. When tuning:
- If you set the number too high, similar answers may be split into many small clusters.
- If you set it too low, distinct themes may be merged together.
- Adjust based on how many responses you have per question.
Minimum cluster size
A minimum cluster size of 3 helps avoid “false” insights based on only one or two answers. This also reduces noise from ad hoc responses, such as names or very short comments.
Batching large surveys
For large datasets, you should:
- Use n8n Split in Batches or similar nodes for ingestion.
- Batch requests to OpenAI to avoid rate limits and memory issues.
- Monitor throughput between n8n, Qdrant, and OpenAI APIs.
Handling PII and privacy
Participant names and IDs are stored as metadata and may be exported to the Insights sheet. For privacy:
- Mask or hash participant identifiers before sharing the sheet externally.
- Review which metadata fields are included in the exported results.
Managing costs
API costs come from two main sources:
- OpenAI embeddings for every answer
- LLM calls for summarizing each valid cluster
To optimize costs:
- Cache embeddings and summaries where possible so you do not recompute them unnecessarily.
- Batch requests to improve efficiency.
- Start with a small dataset to estimate cost per survey before scaling up.
Troubleshooting and scaling your workflow
Issue: ingestion from Google Sheets is slow
Try the following:
- Split a very large spreadsheet into smaller sheets.
- Use incremental updates that only ingest new or changed rows.
- Check that your n8n credentials have sufficient API quotas for Google Sheets, Qdrant, and OpenAI.
Issue: clusters are noisy or there are too many
To improve cluster quality:
- Reduce the maximum number of clusters in the K-means node.
- Increase the minimum cluster size threshold.
- Pre-filter very short or low-signal answers (for example, single-word responses) before generating embeddings.
Issue: LLM summaries are inconsistent
If the insights feel vague or inconsistent:
- Improve the system prompt used in the Information Extractor or LLM node.
- Add a few-shot example to show the LLM what a good output looks like.
- Keep the prompt focused on the fields you need:
- Concise summary
- Actionable insight
- Clear sentiment label from the defined set
Why keep participant IDs and raw responses?
Including participant IDs and raw answers in your outputs gives you:
- Auditability – You can always trace an insight back to the exact responses that created it.
- Transparency – Stakeholders can see representative quotes and counts, which builds trust in the automated analysis.
- Flexibility – You can re-check or re-cluster specific subsets of participants if needed.
If someone questions a particular insight, you can quickly show:
- Which participants were included
- How many responses contributed
- What those participants actually wrote
How to get started with the n8n survey analysis template
This workflow is ideal for teams that run frequent surveys and want a repeatable, transparent way to generate insights. To try it out:
- Import the n8n workflow template into your n8n instance.
- Configure credentials for:
- Google Sheets
- OpenAI
- Qdrant
- Tune the settings:
- Embedding model choice
- Maximum number of clusters
- Minimum cluster size
- LLM prompt and output format