n8n Creators Leaderboard Reporting Workflow
This guide walks you step by step through an n8n workflow template that pulls community statistics from a GitHub repository, ranks top creators and workflows, and generates a daily leaderboard report. It is ideal for community managers, maintainers, or anyone who wants automated insights into contributors and the most-used workflows.
What you will learn
By the end of this tutorial-style walkthrough, you will understand how to:
- Set up an automated n8n workflow that runs on a schedule.
- Fetch and parse JSON stats from a GitHub repository.
- Sort and limit creators and workflows based on weekly activity.
- Merge creator and workflow data into a single enriched dataset.
- Use an LLM (OpenAI or Google Gemini) to generate a human-readable Markdown report.
- Convert the report to HTML and deliver it via Google Drive, Gmail, Telegram, or local storage.
- Customize ranking metrics, notifications, and storage for your own needs.
Why automate a creators leaderboard in n8n?
Manually tracking community contributions is time-consuming and easy to delay or skip. An automated n8n workflow:
- Quantifies contributor impact using consistent metrics.
- Highlights top workflows and creators regularly without manual effort.
- Surfaces trends in adoption and attention (visitors, inserters, etc.).
- Outputs shareable reports in Markdown and HTML that can be emailed, posted, or archived.
At its core, this workflow pulls JSON statistics, enriches them, ranks creators and workflows, then generates a report and delivers it through your chosen channels.
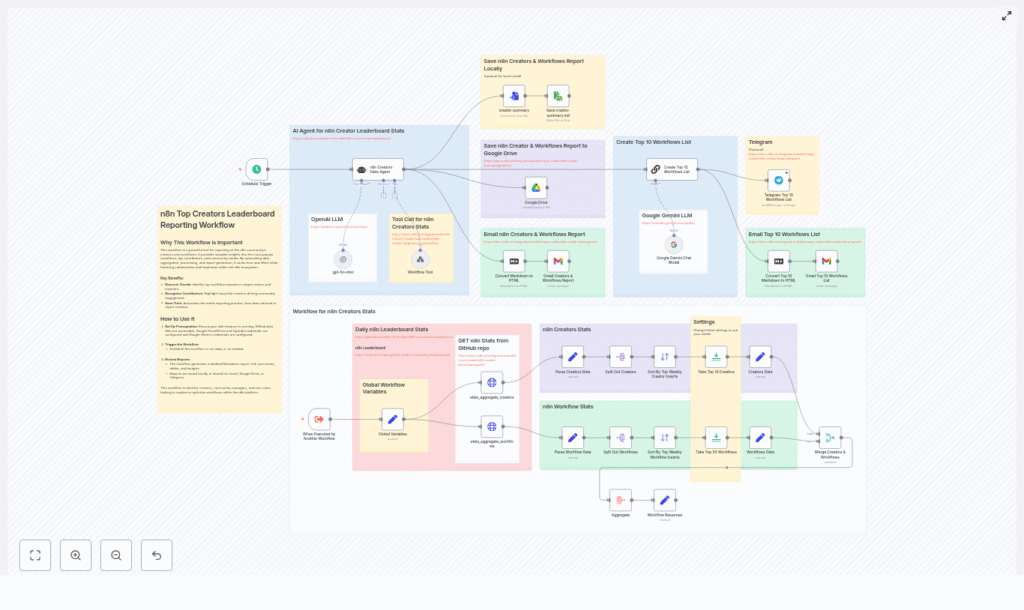
Core concepts and data flow
Before jumping into the setup, it helps to understand the overall data flow inside n8n. The workflow runs through these main stages:
1. Trigger and configuration
- Schedule Trigger node starts the workflow on a daily schedule (or any cadence you configure).
- Global Variables (Set node) defines reusable values like:
- GitHub raw base path.
- Filenames for stats (
stats_aggregate_creatorsandstats_aggregate_workflows). - Runtime datetime for timestamping reports.
2. Data collection from GitHub
- HTTP Request nodes (one for creators, one for workflows) fetch JSON files from a GitHub repository using URLs like:
https://raw.githubusercontent.com/teds-tech-talks/n8n-community-leaderboard/refs/heads/main/{{filename}}.json - Each node retrieves a raw JSON file that contains aggregated stats for either creators or workflows.
3. Parsing and splitting records
- Parse Creators Data / Parse Workflow Data (Set nodes) normalize the raw JSON into a consistent
dataarray. This creates a uniform structure that downstream nodes can rely on. - Split Out Creators / Split Out Workflows nodes break the
dataarray into individual items so each creator or workflow can be processed, sorted, and limited separately.
4. Ranking creators and workflows
- Sort nodes order:
- Creators by
sum_unique_weekly_inserters. - Workflows by
unique_weekly_inserters.
- Creators by
- Limit nodes keep only the top N records (for example, top 10 creators and top 50 workflows) so your report remains focused and readable.
5. Enriching data and merging
- Set nodes for Creators Data and Workflows Data map only the fields you care about into compact records, such as:
- Creator name and username.
- Avatar URL.
- Unique visitors and inserters.
- Workflow titles, slugs, or identifiers.
- Merge Creators & Workflows combines these records using
usernameas the key. This step enriches each creator with their associated workflows and metrics, giving you context about what is driving their popularity.
6. Aggregation and report generation
- Aggregate node collects all merged items into a single structured payload that represents the full leaderboard and stats.
- n8n Creators Stats Agent / LLM integrations (OpenAI or Google Gemini) take this aggregated payload and:
- Generate a Markdown report.
- Add narrative summaries, highlights, and insights.
7. Output formatting and delivery
- Convert Markdown to HTML node transforms the Markdown report into HTML, which is ideal for email.
- Delivery nodes then send or store the report:
- Gmail to email the report.
- Google Drive to store the report file.
- Telegram to send a summary or link.
- ConvertToFile / ReadWriteFile to save locally (for example,
creator-summary.md).
Step-by-step setup in n8n
1) Prerequisites
Before importing the template, make sure you have:
- An n8n instance (cloud or self-hosted).
- Access to the GitHub repository that contains the stats JSON files, or your own data source with similar JSON structure.
- An OpenAI or Google Gemini API key if you want to use the LLM-based report generation.
- Google Drive and Gmail credentials if you plan to store or email the reports through those services.
2) Import the workflow template
Download or copy the template JSON from the repository and import it into your n8n instance. The imported workflow will already connect nodes such as:
- Schedule Trigger
- HTTP Request
- Set (for Global Variables and data mapping)
- Split Out
- Sort
- Limit
- Merge
- Aggregate
- Convert Markdown to HTML and file handling nodes
3) Configure the schedule
Open the Schedule Trigger node and choose how often you want the leaderboard to run. Common options include:
- Daily at a fixed time for a regular report.
- Weekly for a longer-term summary.
- Manual execution during testing or ad-hoc reporting.
4) Set up global variables
Next, open the Global Variables (Set) node. Here you define the values that the rest of the workflow will reference:
- path: the base GitHub raw URL or your equivalent data source.
- creators filename:
stats_aggregate_creators(without the.jsonextension). - workflows filename:
stats_aggregate_workflows(also without the extension). - datetime: optional timestamp value that can appear in your report title or file name.
If your repository uses different filenames or folders, update these values accordingly so the HTTP Request nodes can build the correct URLs.
5) Connect API credentials
Now attach the necessary credentials to the relevant nodes:
- LLM agent nodes:
- Connect OpenAI or Google Gemini credentials if you want AI-generated summaries.
- Google Drive and Gmail nodes:
- Authenticate with your Google account or service account.
- Verify scopes allow writing files to Drive and sending emails through Gmail.
- Telegram or other messaging nodes (if present):
- Configure bot tokens or webhooks as required.
If you prefer not to use an LLM, you can replace the agent node with a standard Set node or a simple Markdown template to build a static report from the aggregated data.
6) Verify data fetching and parsing
Before relying on the full automation, test the data path:
- Run the workflow manually.
- Inspect the output of the HTTP Request nodes:
- Confirm the JSON matches what you expect from the GitHub repository.
- Check the Parse Creators Data and Parse Workflow Data nodes:
- Ensure each one produces a
dataarray. - Confirm the fields like
username,sum_unique_weekly_inserters, andunique_weekly_insertersare present.
- Ensure each one produces a
- Look at the Split Out nodes to verify that each item in the array becomes its own n8n item.
7) Check sorting, limiting, and merging
Once data is flowing correctly, examine the ranking logic:
- Sort nodes:
- Creators should be sorted by
sum_unique_weekly_inserters. - Workflows should be sorted by
unique_weekly_inserters.
- Creators should be sorted by
- Limit nodes:
- Adjust the limit values (for example, 10 creators, 50 workflows) to match how long you want your leaderboard to be.
- Set nodes for compact records:
- Confirm that each record includes the fields you plan to show in the report, such as creator name, username, avatar, and workflow details.
- Merge Creators & Workflows:
- Verify that the merge key is
usernamein both datasets. - Check that creators now have attached workflow lists and metrics.
- Verify that the merge key is
8) Validate aggregation and report generation
Next, focus on the reporting section:
- Aggregate node:
- Inspect the output to ensure it contains all merged creator records in a single structured payload.
- LLM agent node:
- Confirm the prompt references the aggregated data and instructs the model to generate a Markdown leaderboard.
- If the wording or tone of the report is not what you want, refine the prompt or adjust temperature and other parameters.
9) Configure HTML conversion and delivery
Finally, configure how the report is presented and delivered:
- Convert Markdown to HTML:
- Check that the Markdown from the LLM is successfully converted to HTML.
- Preview the HTML in an email client or browser if possible.
- Gmail node:
- Set the recipient list, subject line, and body content.
- Use the HTML output as the email body for a nicely formatted report.
- Google Drive node:
- Specify the folder and filename pattern, for example including the date from the Global Variables node.
- Telegram or other channels:
- Send a short summary message, link, or attached file, depending on what the node supports.
- Local saving:
- Use ConvertToFile and ReadWriteFile to write a local
creator-summary.mdor HTML file for archival.
- Use ConvertToFile and ReadWriteFile to write a local
Customizing and extending the workflow
Adjust ranking metrics
You are not limited to the default metrics. You can:
- Rank by unique visitors instead of unique inserters if you care more about attention and traffic than actual adoption.
- Combine metrics in a custom field using a Set node before sorting, for example a weighted score.
Change notification channels
If Gmail or Telegram are not part of your stack, replace or supplement those nodes with:
- Slack nodes for posting leaderboard summaries to a channel.
- Microsoft Teams nodes for internal dashboards.
- Other messaging or webhook-based integrations supported by n8n.
Store historical data for trends
To analyze trends over time, you can:
- Append a CSV line to a Google Sheet after each run.
- Insert records into a database (for example, PostgreSQL or MySQL) for more advanced querying and visualization.
- Keep a daily archive of Markdown or HTML reports in Google Drive or local storage.
Enhance the LLM agent prompts
The default LLM prompt can be expanded to include more narrative structure, such as:
- Community highlights or shout-outs to new contributors.
- Short bios or profile snippets for top creators.
- Gratitude messages and calls to action for the community.
Small adjustments to the prompt can significantly change the style and depth of the generated report.
Troubleshooting common issues
- HTTP Request returns 404:
- Check that the GitHub raw path is correct.
- Verify the branch name (for example
main) and file names match your repository.
- Merge node produces empty results:
- Confirm that
usernameexists in both creators and workflows JSON records. - Ensure the Merge node is configured to use
usernameas the join key on both inputs.
- Confirm that
- LLM report is not what you expect:
- Lower the temperature for more consistent, less creative output.
- Refine the system or user prompt to clearly describe the desired report structure and tone.
- Permission errors with Google Drive or Gmail:
- Re-authenticate OAuth credentials in n8n.
- Check that the account or service account has access to the target Drive folder and permission to send emails.
Security and privacy considerations
When working with contributor data and automated reports, keep the following in mind:
- Avoid exposing personal data if your reports are public. Consider anonymizing usernames or aggregating results.
- Restrict access to n8n credentials, especially API keys for OpenAI, Google Gemini, Gmail, and Drive.