Real Estate Market Trend Report: Build an Automated AI Pipeline With n8n
If you have ever tried to pull together a real estate market trend report by hand, you know how painful it can be. Hunting for data, copying numbers into spreadsheets, writing summaries from scratch – it gets old fast. The good news is that you can automate most of it with an AI-powered pipeline built in n8n.
In this guide, we will walk through how a real estate market trend report workflow works, what each part of the pipeline does, and how it all comes together to give you consistent, repeatable insights. We will talk about webhooks, text splitting, embeddings, vector stores, agents, and how everything plugs into tools like Google Sheets or dashboards.
Think of this as your blueprint for turning messy property data into clear, structured, AI-generated market reports, without babysitting the process every time.
Why bother automating real estate market reports?
Let us be honest. Manual reports are not just annoying, they are risky. They are slow, hard to reproduce, and often depend on that one person who “knows the spreadsheet.” Automation helps you escape that trap.
With an automated n8n workflow for real estate market trend reports, you get:
- Faster turnaround – new listings, feeds, and news can be ingested automatically, so you are not waiting on manual exports.
- Consistent methodology – the same steps, models, and calculations run every time, which means less guesswork and fewer errors.
- Scalability – you can cover more regions, property types, and time periods without multiplying your workload.
- Actionable insights – embeddings and a vector store let you surface relevant history and context, which makes your AI summaries smarter and more grounded.
In short, you get to spend less time wrangling data and more time actually using the insights.
What this AI pipeline actually does
So what does this n8n-based pipeline look like in practice? At a high level, it takes raw real estate data, structures it, enriches it with embeddings, and then uses an AI agent to produce a clear narrative report and metrics. Finally, it saves the results somewhere useful, like Google Sheets or a dashboard.
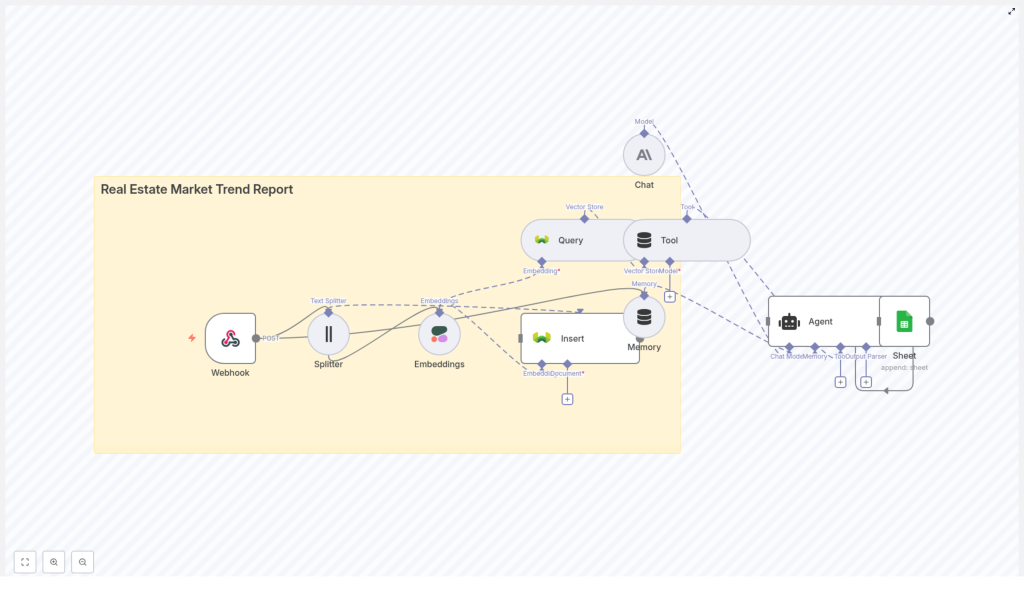
Here is the basic flow:
- Webhook receives raw inputs like CSV files, API payloads, or manually uploaded data.
- Text splitter breaks longer documents into smaller, overlapping chunks so they can be embedded properly.
- Embedding model converts each chunk into a numeric vector that captures its meaning.
- Vector store (Weaviate) stores those embeddings and lets you search them semantically.
- Agent + chat model pull relevant context from the vector store and memory, then write a structured trend report.
- Output step appends the final results to Google Sheets or publishes them to a dashboard or email.
Each of these parts has a job to do. Let us break them down in a more conversational way.
Step 1: Ingesting data with a webhook
Webhook as your single entry point
First, you need a way to get data into your workflow. That is where a webhook comes in. In n8n, the webhook node acts as the front door to your pipeline.
You can configure it to accept POST requests from sources such as:
- MLS feeds or property listing APIs
- Market research exports and CSV uploads
- News scrapers that track local real estate stories
- Manual uploads or internal tools that send data via HTTP
The beauty of a webhook is that it centralizes ingestion. As soon as new data hits that endpoint, n8n triggers the rest of the workflow automatically. You can schedule nightly runs, near real-time updates, or connect it to other automations that push data whenever something changes.
Step 2: Preparing text with a splitter
Why text splitting matters
Embedding models work best when they receive text in manageable chunks. If you feed them very long reports, important context can get truncated. On the other hand, if chunks are too small, you lose meaning.
That is why the workflow uses a text splitter. It takes long documents and breaks them into overlapping segments so the model sees enough context without being overloaded.
Typical production settings look like this:
- Chunk size: around 300 to 500 characters
- Overlap: around 20 to 40 characters
You can tune these values depending on your content. Short property descriptions might not need much splitting at all, while full-length market reports benefit from slightly larger chunks with overlap so the narrative flows naturally across boundaries.
Step 3: Turning text into embeddings
Embeddings with Cohere or similar models
Once your text is split, the next step is to convert each chunk into an embedding, which is just a numeric vector that represents the meaning of the text. This is what allows the system to later say, “show me similar documents to this query” or “retrieve relevant context for this region and time period.”
You can use an embedding model such as:
- Cohere
- OpenAI
- Or an open source alternative tuned for semantic tasks
These vectors make it possible to:
- Find comparable property descriptions
- Retrieve past market commentary that relates to a specific city or property type
- Surface relevant documents for a given query, like “San Francisco condos last 30 days”
The specific embedding dimension or model you choose will depend on your budget and performance needs. A reliable commercial model is a good starting point, and you can always experiment with smaller or local models later if you need to optimize cost or latency.
Step 4: Storing context in Weaviate
Using a vector store for semantic search
Now that you have embeddings, you need somewhere to store and query them. That is where Weaviate comes in as your vector database.
In this workflow, Weaviate is used to:
- Store embeddings for all your documents and chunks
- Run fast nearest-neighbor searches to find similar content
- Filter by metadata such as city, property type, or date
You might create an index with a clear name like real_estate_market_trend_report so it is easy to separate this project from other data you store.
With Weaviate in place, your agent can ask questions like “what is happening with inventory in this neighborhood over the past quarter?” and actually retrieve the most relevant documents to support its answer.
Step 5: Letting the agent write the story
How the agent and chat model work together
This is the fun part. After the data is ingested, split, embedded, and stored, an agent steps in to orchestrate everything and produce a readable market trend report.
The agent typically uses:
- A vector store search to pull relevant chunks from Weaviate
- A memory buffer to keep track of prior reports or important context
- A chat model such as Anthropic or another LLM to generate the final narrative
You can configure the agent to focus on the insights you care about, such as:
- Aggregating price changes by region and property type
- Highlighting supply and demand indicators like new listings or average days on market
- Flagging anomalies such as sudden inventory spikes or rapid price jumps
When you request a report, the process usually looks like this:
- The agent pulls the latest relevant embeddings based on your query, for example “San Francisco condos last 30 days.”
- It retrieves memory snippets such as prior reports or analyst notes so the tone and context stay consistent over time.
- It aggregates numeric metrics from your time-series store or from the retrieved documents.
- It sends a structured prompt to the chat model, asking it to generate an executive summary, detailed findings, and clear recommendations.
The result is a market trend report that feels like a human analyst wrote it, but with the speed and consistency of automation.
Step 6: Saving and sharing your results
From AI output to something stakeholders can use
Once the agent has created the report, you still need a convenient way to share it. In the n8n workflow, the final step pushes the output wherever your team actually works.
Typical options include:
- Google Sheets – append each new report as a row, including key metrics and links to full text.
- Dashboards – send the data to BI tools for charts, filters, and interactive exploration.
- Email or internal tools – notify stakeholders automatically when a new report is ready.
This way, the pipeline does not just generate insights, it also makes them visible and easy to act on.
What should your trend report actually include?
Automation is powerful, but it only helps if you are tracking the right things. A strong real estate market trend report usually blends hard numbers with contextual signals so readers get both the “what” and the “why.”
Core metrics to track
- Median sale price by region and property type
- Average days on market
- New listings vs. closed sales to capture the supply and demand ratio
- Price per square foot
- Inventory measured in months of supply
Contextual signals that add meaning
- Mortgage rate trends and lender activity
- Local economic indicators like employment levels and new construction permits
- News and policy events such as zoning changes, tax incentives, or new infrastructure
Your AI agent can weave these metrics and signals into a narrative that explains not just what is happening, but also what might be driving those changes.
Visualizing your real estate market trends
Even the best-written report benefits from a few clear visuals. Once your pipeline is generating structured data, you can easily plug it into dashboards or charting tools.
Common visualizations include:
- Time-series charts for median price and inventory trends
- Heat maps showing price changes by neighborhood
- Bar charts comparing new listings vs. closed sales
These visuals work nicely alongside automated email reports, web dashboards, or shared Google Sheets so everyone has the same view of the market.
Keeping your data pipeline clean and trustworthy
Best practices and data governance
Because this workflow relies heavily on data quality, it is worth putting some guardrails in place. Here are a few practices to keep in mind:
- Source reliability: prioritize official MLS feeds, government datasets, and trusted aggregators.
- Data freshness: schedule regular ingestion and re-indexing so your insights stay current.
- Rich metadata: store fields like city, neighborhood, property type, and date with each embedding for precise filtering.
- Audit trails: log data ingestion steps and agent prompts to Google Sheets or a database so you can debug issues and track changes.
- Bias and fairness: monitor AI outputs for biased or misleading statements, and add clear instructions and guardrails in the agent prompt.
Good governance makes your automated reports not just fast, but also reliable enough for real decisions.
How often should you re-index or update data?
The right cadence depends on how fast your markets move.
- For fast-moving markets, consider nightly re-indexing or even hourly updates for certain feeds.
- For slower regions, a weekly schedule might be perfectly fine.
The n8n workflow can be triggered on a schedule or whenever new data arrives, so you can mix both strategies if needed.
Choosing the right embedding model
There is no single “best” embedding model for every use case, but you can make a smart choice by thinking about three things: quality, cost, and speed.
- Start with a reliable commercial model like Cohere or OpenAI and test whether retrieval results are relevant for your queries.
- If latency or cost becomes an issue, experiment with smaller or local models after you have a baseline.
- Benchmark a few options using real queries such as “2-bedroom townhomes inventory in Austin last quarter” and compare which model surfaces the most helpful context.
Can you add forecasting to this workflow?
Yes, you can. The template focuses on retrieval and summarization, but it is straightforward to layer forecasting on top.
You can combine the retrieved historical context with time-series models such as:
- ARIMA
- Prophet
- Other ML-based forecasting models
Using historical price and inventory time-series data, you can train forecasting models and then feed their outputs into the agent. The agent can then present both current trends and forward-looking estimates in the same report.
Implementation checklist for your n8n workflow
Ready to put this into practice? Here is a compact checklist you can follow while setting up the template in n8n:
- Define your report scope: regions, cadence, property types, and key metrics.
- Set up webhook ingestion to accept feeds, CSVs, or API payloads and trigger processing.
- Configure the text splitter with tuned chunk size and overlap values.
- Choose and configure your embedding model (Cohere or equivalent).
- Deploy Weaviate with an index such as real_estate_market_trend_report and a metadata schema for city, property type, date, etc.
- Design your agent prompts, including rules for memory buffering and retrieval.
- Connect outputs to Google Sheets, email, or dashboards so stakeholders can access the reports.
- Run end-to-end tests with sample data, review the AI-generated reports, and iterate on prompts and settings.
When this template is a great fit
You will get the most value from this n8n workflow template if you:
- Produce recurring market analysis for multiple regions or property types.
- Rely on a mix of structured data (prices, days on market) and unstructured text (