Solar Output Forecaster with n8n & Vector AI
The day Maya realized her solar data was useless without a brain
Maya had a dashboard problem.
As the operations lead for a growing solar company, she was drowning in telemetry from dozens of sites. Power readings, timestamps, panel types, weather notes, one-off comments from field engineers – everything flowed into her systems every few minutes.
Yet whenever a stakeholder asked a simple question like, “What will output look like tomorrow for Site 123 with this cloud pattern?” she found herself opening spreadsheets, scrolling through logs, and guess-timating based on memory.
The data was there, but it had no memory, no context, no way to reason about similar past events. Each site had years of history that might contain the answer. She just could not get to it fast enough.
That changed the week she discovered an n8n workflow template called the Solar Output Forecaster, built on vector embeddings, memory, and an AI agent.
Why Maya needed more than time-series charts
At first, Maya assumed classic time-series analytics would be enough. But solar output is not just about a neat line chart over time. It is also about the story behind each drop or spike:
- Which site and which string was affected?
- What panel type was installed?
- What did the technician write in the notes that day?
- Was there intermittent shading, cleaning, or recalibration?
Her logs had all this contextual metadata, but it lived in free-text notes and loosely structured fields. Searching for “shading” or “cloudy” helped a bit, but it did not surface the most similar historical scenarios or let anyone reason over them in a structured way.
When she read that the Solar Output Forecaster template used n8n, embeddings, Supabase vector store, memory, and an AI agent to connect raw solar data to actionable forecasts, it felt like the missing piece. It promised a pipeline that could:
- Capture incoming solar data via a webhook
- Split messy notes into manageable semantic chunks
- Turn those chunks into vector embeddings
- Store them in a Supabase vector index
- Run similarity search on demand
- Let an agent with memory reason over the results
- Log everything in Google Sheets for auditing
It sounded like giving her data a brain.
Setting the stage in n8n: wiring the workflow
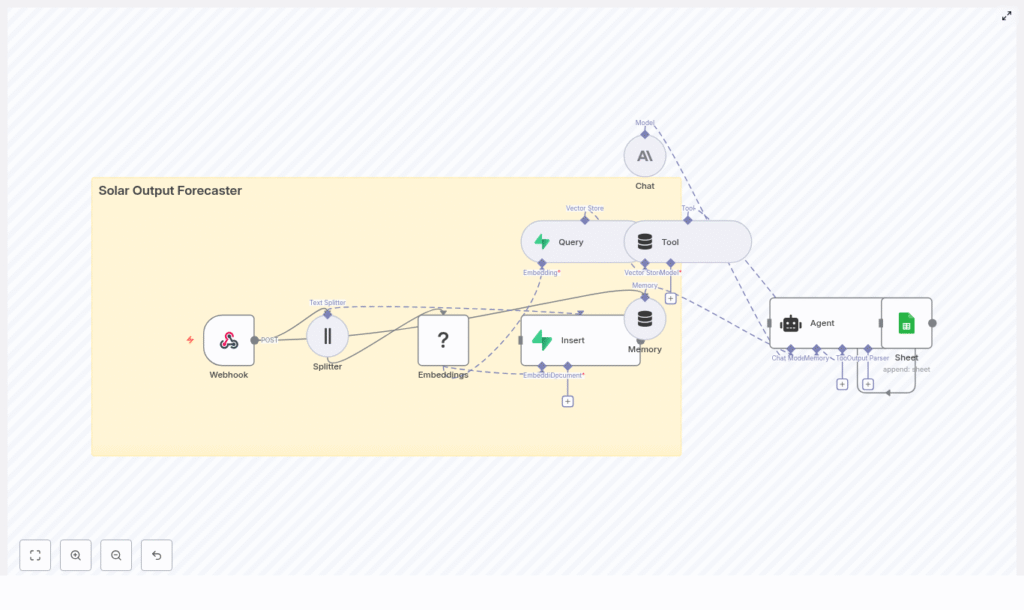
Maya opened n8n, imported the Solar Output Forecaster template JSON, and saw a graph of nodes that told a story of their own. Instead of reading a dry spec, she clicked through each node as if following a character list in a script.
The Webhook: where the story begins
The first node was the Webhook, the gateway into the whole system. Its endpoint path was already defined as:
/solar_output_forecasterIt was configured to accept POST requests from data collectors, IoT gateways, or scheduled jobs. The expected JSON payload looked familiar, almost like the raw data she already had:
{  "site_id": "site-123",  "timestamp": "2025-07-01T10:00:00Z",  "power_kw": 12.45,  "notes": "Partly cloudy, sensors calibrated",  "metadata": { "panel_type": "Mono PERC", "azimuth": 180 }
}
She added a quick validation step so malformed payloads would be rejected, and made a note to log origin IPs for security. For the first time, her incoming solar data had a clearly defined entrance into a forecasting pipeline.
The Splitter: breaking long stories into useful pieces
Next in the chain was the Splitter. Maya realized that a single “notes” field could contain paragraphs of text from technicians, weather observations, and one-off comments. That is hard for models to process directly.
The template suggested splitting large textual fields into 400-character chunks with a 40-character overlap. This overlap preserved enough context between chunks while keeping each one short enough for efficient embedding.
In her mind, this was like turning a long maintenance report into a set of short, searchable anecdotes, each with enough detail to be understood on its own.
Embeddings with Hugging Face: teaching the system what “shading” really means
The next node, Embeddings (Hugging Face), felt like the moment the system started to “understand” her data.
Instead of treating text as raw strings, this node turned each chunk into a vector representation that captured its semantic meaning. “Partly cloudy,” “intermittent shading,” and “dirty panels” were no longer just words. They became points in a high-dimensional space that could be compared for similarity.
She configured the node with an embeddings model compatible with her Hugging Face API key, and made a mental note of a crucial rule: use the same embedding model for both indexing and querying. That consistency keeps the embedding space stable so similarity searches remain accurate over time.
Supabase Vector Store: building a searchable memory
Once chunks were embedded, they flowed into the Insert (Supabase Vector Store) node. This was where her unstructured notes turned into a structured, queryable memory.
The template wrote each chunk into an index called:
solar_output_forecasterFor every vector, it stored fields like:
site_idtimestampchunk_idoriginal_text- Any additional tags or metadata
With Supabase providing a managed Postgres plus vector extension, she did not have to architect her own storage or indexing system. Her historical solar events were now in a true vector store, ready for similarity search.
The turning point: when a real incident put the workflow to the test
A week after deployment, Site 123 started showing erratic midday dips in power output. The operations team pinged Maya in a panic.
“Is this inverter failure or shading?” her CEO asked. “Do we have anything similar in the past that can guide us?”
In the past, Maya would have opened multiple dashboards, filtered dates, and skimmed old technician notes. This time, she turned to the new n8n workflow.
From payload to forecast, live
She triggered the process with a POST request that looked like this:
curl -X POST https://your-n8n-host/webhook/solar_output_forecaster \ -H "Content-Type: application/json" \ -d '{"site_id":"site-123","timestamp":"2025-07-01T10:00:00Z","power_kw":12.45,"notes":"Partly cloudy, intermittent shading","metadata":{"panel_type":"Mono PERC"}}'
Behind the scenes, the following story unfolded:
- The Webhook received the POST with 24 hours of power telemetry and notes about intermittent shading.
- The Splitter broke the notes and metadata into multiple 400-character chunks, each with a small overlap, so no important context was lost.
- The Embeddings node converted those chunks into vectors that captured the nuances of “intermittent shading” and “partly cloudy.”
- The Insert node stored these vectors along with site_id, timestamps, and original text in the Supabase vector index.
- When Maya triggered a forecast request, the Query node searched for the most similar past events involving shaded conditions and similar panel types.
- The Agent, using both the retrieved documents and Memory of recent troubleshooting messages, generated a human-readable forecast:
“Expect a 20% dip between 10:00-14:00 local due to intermittent shading. Recommended temporary cleaning of string C and follow-up inspection for nearby obstructions.”
Finally, the Google Sheets node logged the forecast, timestamp, and confidence estimate into a sheet the whole team could see. The answer that used to take hours of manual digging now appeared in seconds.
How the Query, Tool, Memory, and Agent work together
After that incident, Maya wanted to understand the “brain” of the system more clearly. She traced the path from question to forecast.
Query + Tool: turning history into an API
The Query node was configured to run similarity search against the Supabase vector store whenever a forecast or contextual history was requested. It pulled the top-k most similar chunks based on the embeddings.
Those query results were then exposed through a Tool node. In n8n, this Tool wraps the vector store as an agent-accessible resource. That means the AI agent can call it during reasoning, almost like asking, “Show me past events like this.”
In practical terms, it turned her historical telemetry and notes into an internal API that the language model could consult on demand.
Memory: keeping conversations grounded
The workflow also used a sliding window memory. This allowed the agent to remember recent exchanges, troubleshooting steps, or follow-up questions.
If a user asked, “Compare this week’s anomaly to last week’s,” the agent did not have to re-interpret everything from scratch. It could reference prior messages and build on earlier conclusions, which made the forecasts feel more coherent and context-aware.
The Agent (Anthropic chat model): from raw data to clear decisions
At the center of it all was the Agent, powered by an Anthropic chat model in the template. It took three main ingredients:
- Results from the Tool (vector store queries)
- Context from Memory
- Any upstream sensor aggregates, such as averages or peaks
With a well crafted prompt, the agent acted like a specialized solar analyst. It produced forecasts, explanations, and next-step recommendations in plain language that non-technical stakeholders could understand.
Best practices Maya learned along the way
As the Solar Output Forecaster became part of her daily workflow, Maya refined the setup using a few practical guidelines.
1. Design a strong data schema and metadata strategy
She learned quickly that consistent metadata was critical for good retrieval. Each document in the vector store included fields such as:
site_idtimestamppanel_type- Orientation and azimuth
- Weather tags or notes
With these fields indexed, she could filter and refine similarity searches during query time, which improved both speed and relevance.
2. Crafting the right system prompt
Prompt engineering turned out to be as important as the data pipeline. She gave the agent a concise system prompt that defined:
- Its role as a solar analyst
- What to avoid, especially hallucinations and unsupported claims
- How to format forecasts, including time windows, expected change, confidence levels, and recommended actions
- How to cite retrieved documents or reference similar past events
This structure made the outputs more consistent and easier to compare over time.
3. Aligning models and embeddings
To keep the system stable, Maya followed a simple rule: do not mix and match embedding models without a plan.
- She selected an embeddings model and stuck with it for both indexing and querying.
- If she ever decided to change models for cost or latency reasons, she knew she would need to re-index her documents or accept a drop in similarity quality.
4. Security and scale from day one
As usage grew, she hardened the system:
- Protected the webhook with API keys and optional IP allowlists
- Applied rate limits to avoid overload from noisy devices
- Bathed incoming telemetry in batches for higher throughput
- Monitored Supabase vector index sizes and query latency to keep performance healthy
Supabase and Postgres scaled well for her use case, but the monitoring kept surprises at bay.
5. Monitoring, evaluation, and closing the loop
Maya also set up a simple evaluation loop:
- Logged query hits and top-k relevance scores
- Tracked agent output quality and confidence estimates
- Periodically compared forecasts against actual measured output to compute forecast error
When errors were consistently high in certain scenarios, she adjusted prompts, retrieval strategies, or model choices to tighten accuracy.
Deploying the Solar Output Forecaster in your own n8n instance
By the time Maya’s team fully trusted the system, deploying it to new environments had become a repeatable playbook. The steps were straightforward:
- Import the provided workflow JSON into your n8n instance.
- Add credentials for:
- Hugging Face (embeddings)
- Supabase (vector store)
- Anthropic or your preferred LLM provider (agent)
- Google Sheets (logging)
- Configure the webhook endpoint and expose it via n8n’s public URL or a reverse proxy.
- Test with sample POST payloads and confirm that rows are correctly appended to your log sheet.
How Maya extended the system over time
Once the core pipeline was stable, Maya started to experiment.
- She integrated weather APIs so each document included forecast variables like irradiance and cloud cover, which improved context for forecasts.
- She planned scheduled re-indexing jobs to keep the vector store fresh as new data accumulated.
- She connected the output logs in Google Sheets to visualization tools such as Looker Studio and Grafana to plot forecasts against actuals for each site.
What began as a single workflow turned into a broader decision support system for the entire solar portfolio.
The result: from raw telemetry to explainable forecasts
Looking back, Maya realized the biggest win was not just automation. It was explainability.
The Solar Output Forecaster template showed her how to combine:
- Vector embeddings that make text searchable by meaning
- Memory that preserves context across interactions
- An agent that can reason over both documents and live data
- n8n’s low-code nodes to orchestrate everything
Her team could now trace any forecast back to the historical events and notes that informed it, with audit-ready logs sitting in a shared Google Sheet.
Next step: make your solar data think for itself
If you are sitting on a pile of solar telemetry, technician notes, and scattered spreadsheets, you are in the same place Maya started. The difference now is that you do not have to design the architecture from scratch.
Action steps:
- Import the Solar Output Forecaster template into your n8n instance.
- Connect your Hugging Face, Supabase, LLM, and Google Sheets credentials.
- Send a test POST and watch your first forecast land in your log sheet.
If you want a version tailored to your fleet of sites, custom metadata, or specific reporting needs, you can extend the template or work with a specialist to refine it.