Social Buzz Heatmap with n8n & Embeddings
Imagine this: your team manually scrolling through social feeds…
Someone is refreshing Twitter/X, another person has ten Reddit tabs open, and someone else is copy-pasting spicy comments into a spreadsheet. Nobody remembers what the original goal was, but everyone has eye strain. Sound familiar?
This is exactly the kind of repetitive, soul-draining work that automation is born to destroy. Instead of doom-scrolling for insights, you can let an n8n Social Buzz Heatmap workflow quietly collect, analyze, and summarize social chatter for you in real time.
In this guide, you will see how to set up a social listening pipeline using n8n, OpenAI embeddings, Supabase as a vector store, and a lightweight agent that logs insights to Google Sheets. The workflow ingests posts, slices them into chunks, turns them into vectors, stores them, then queries them semantically so you can spot trends, spikes, and topics without lifting more than a finger or two.
What is a Social Buzz Heatmap and why should you care?
A Social Buzz Heatmap is basically your brand’s social radar. It shows:
- What people are talking about (topics)
- How loud they are talking (intensity)
- How they feel about it (sentiment)
For marketing teams, product managers, and community managers, this means you can:
- Prioritize which conversations to jump into
- Catch product issues before they blow up
- Track campaign impact in something close to real time
By using embeddings and a vector store, you are not just doing keyword search. You get semantic search, so you can find related posts even when people phrase things differently. For example, “login is broken”, “can’t sign in”, and “auth is busted” will all live happily together in your search results.
How the n8n Social Buzz Heatmap workflow works
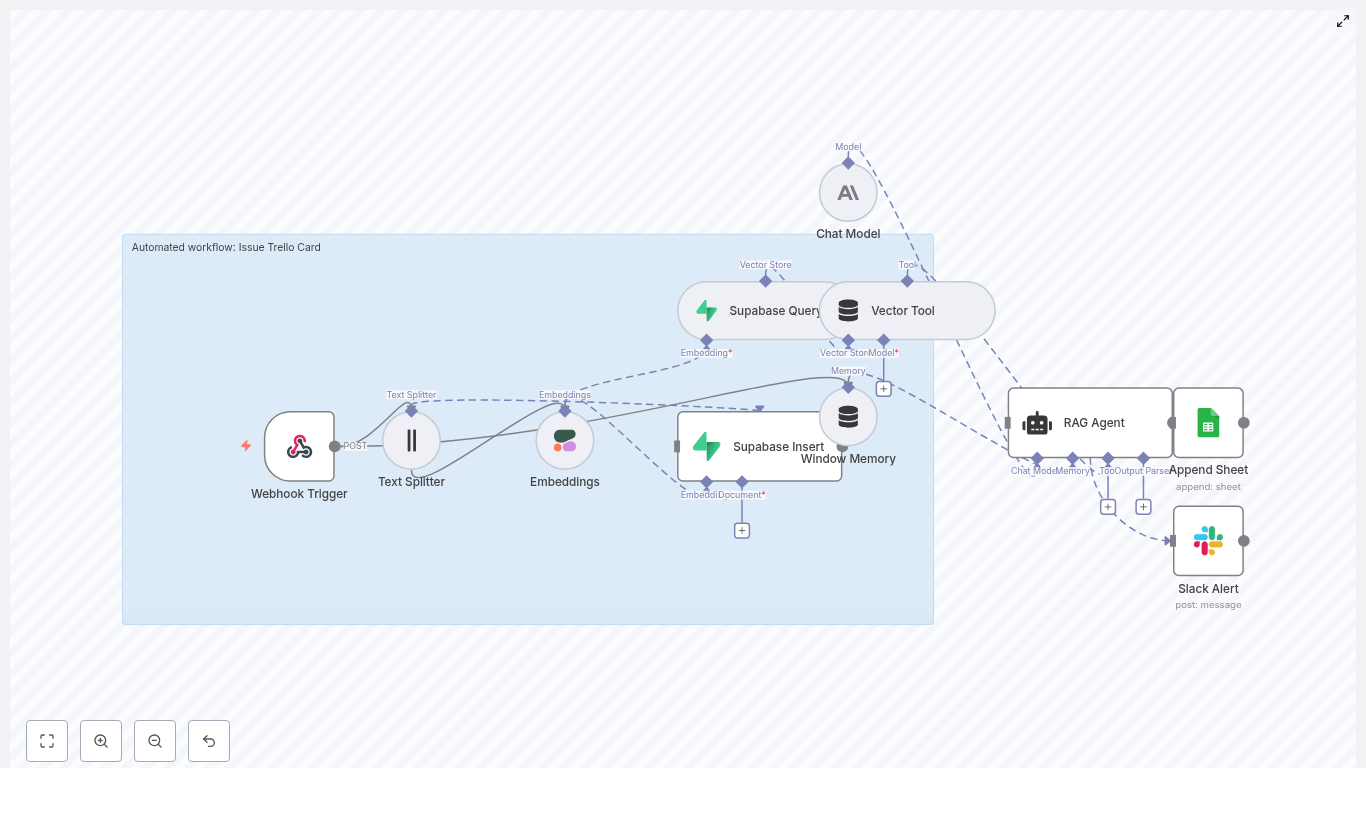
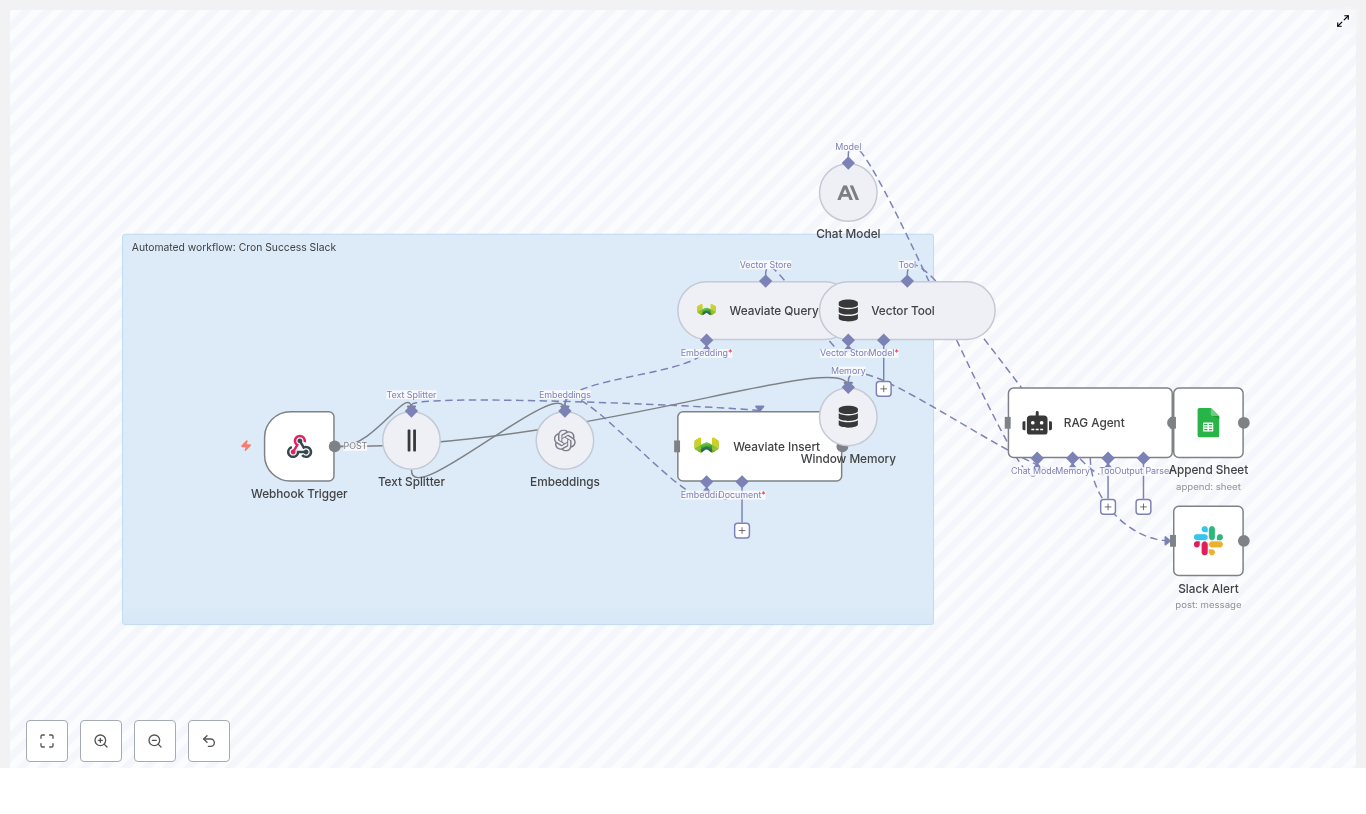
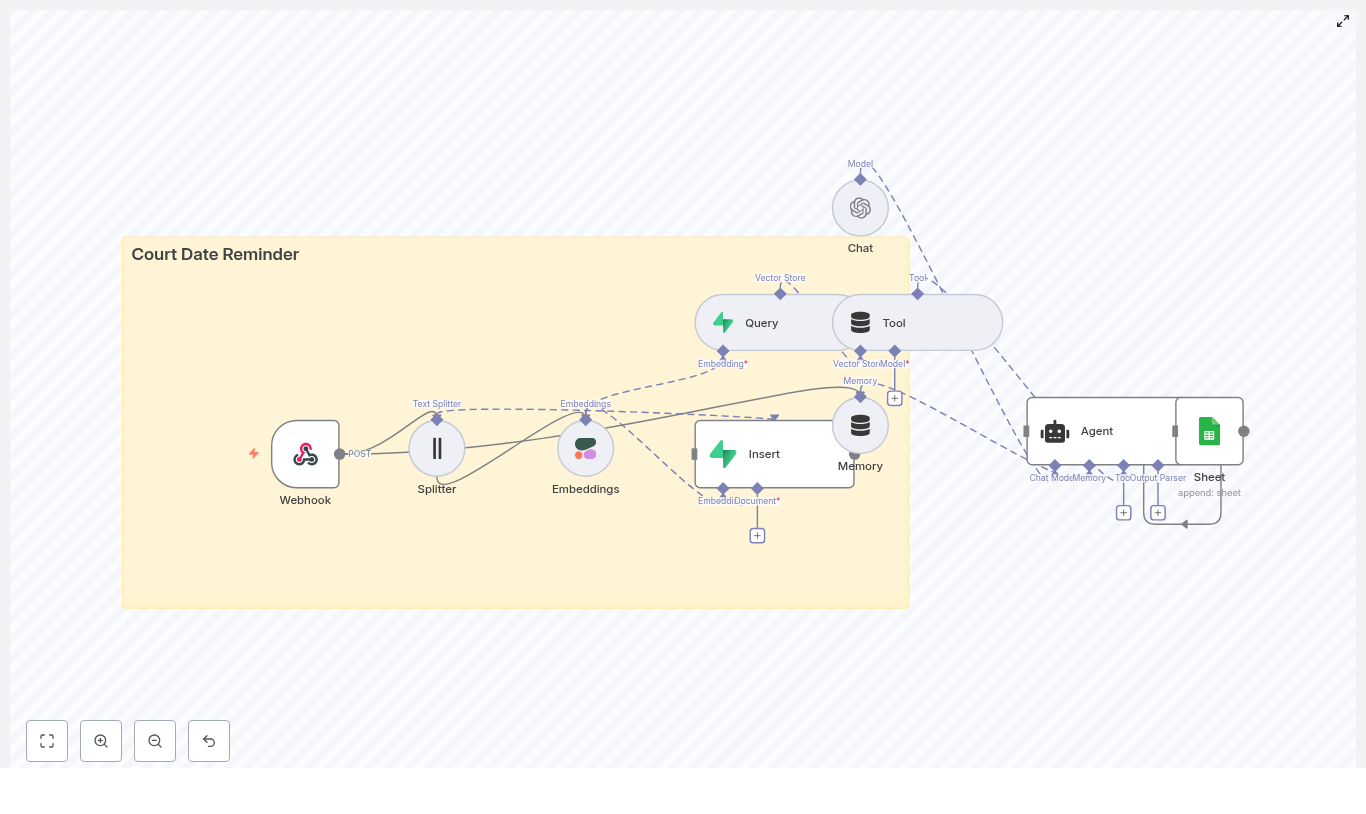
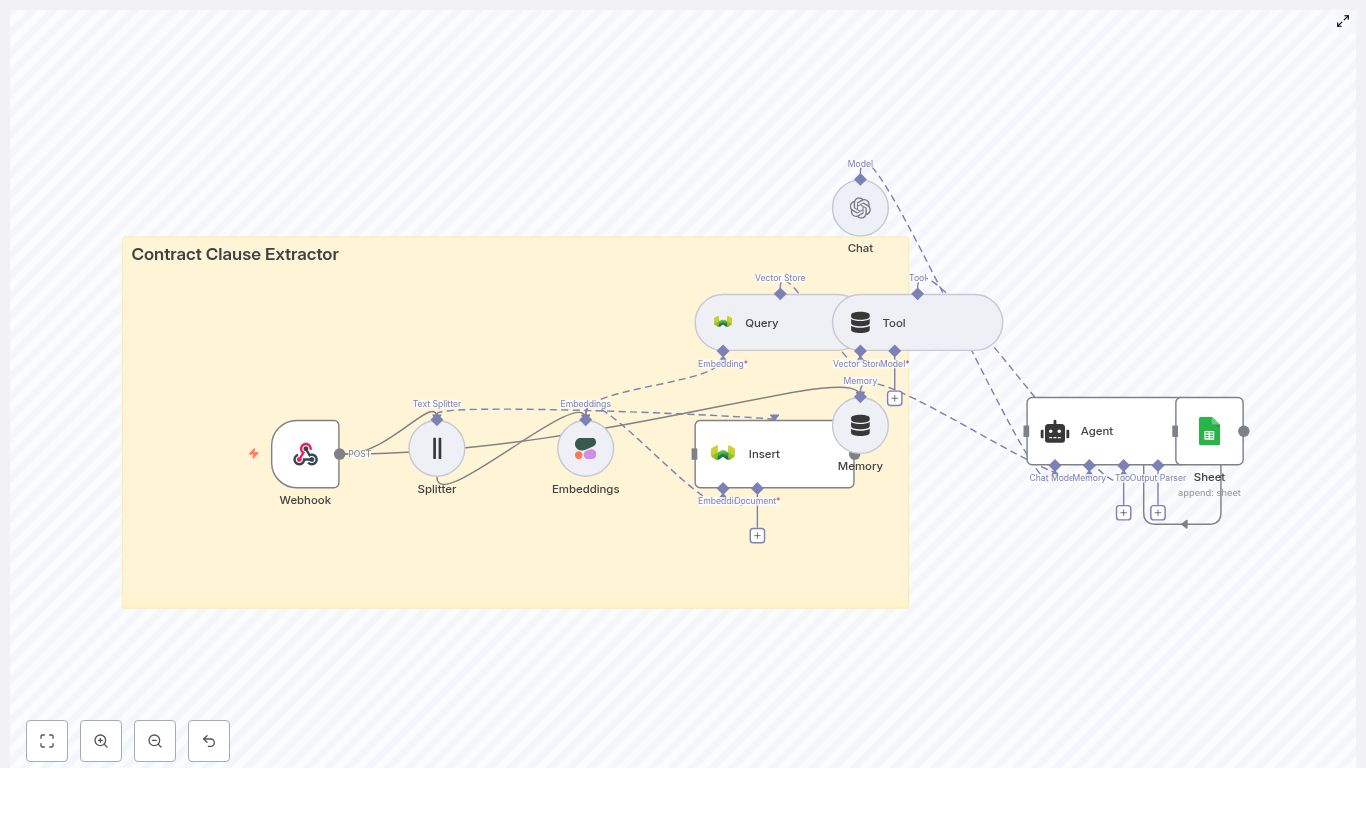
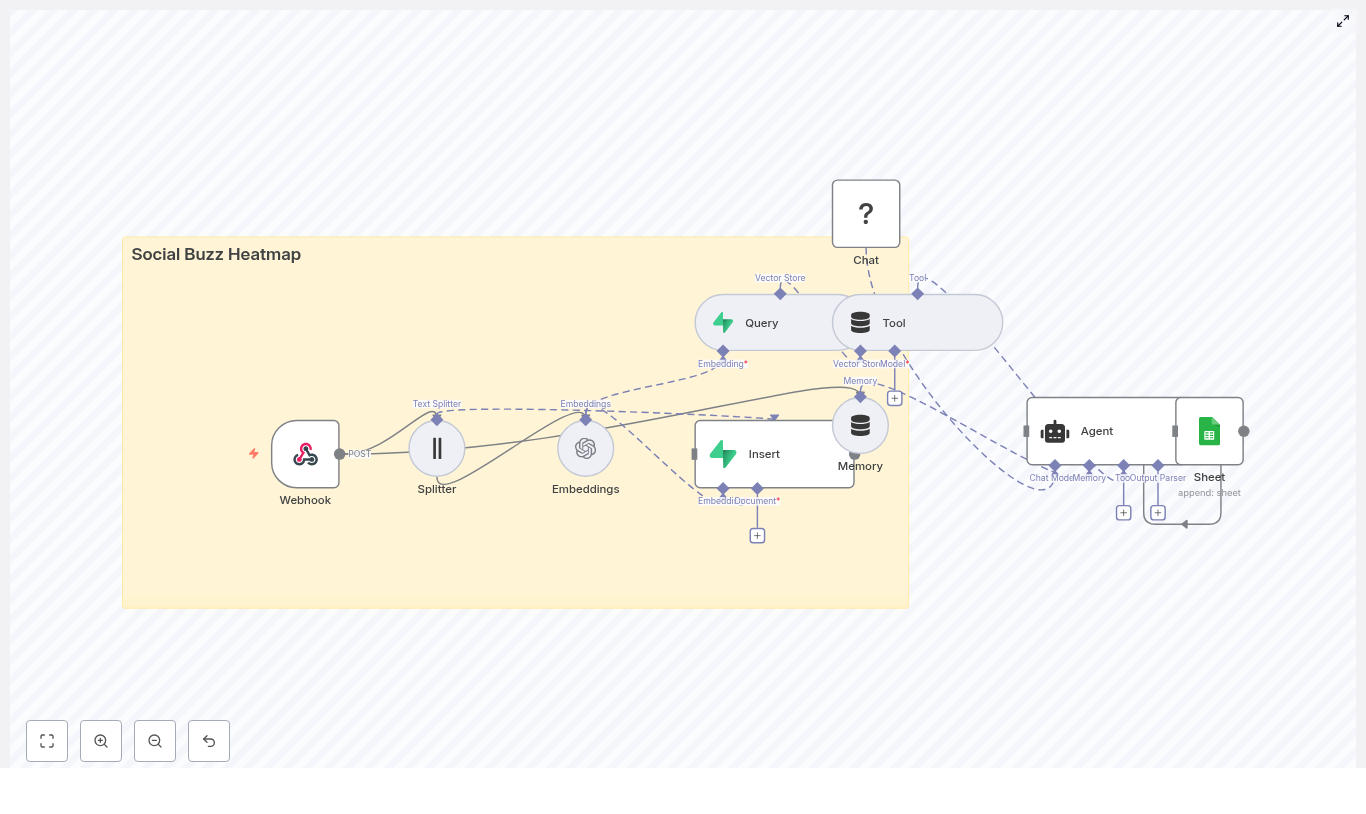
The n8n template wires together several tools into a single pipeline that looks roughly like this:
- Webhook – receives social post payloads via POST
- Splitter – breaks long posts into smaller text chunks using
chunkSizeandchunkOverlap - Embeddings (OpenAI) – converts each chunk into a vector embedding
- Insert (Supabase vector store) – stores vectors and metadata in Supabase
- Query (Supabase) + Tool – runs semantic searches against the vector index
- Memory (Buffer window) – keeps short-term conversational context
- Chat (LM) + Agent – turns raw results into human-friendly insights and decides what to log
- Google Sheets – appends heatmap summaries and logs to a sheet
The end result is a near real-time, searchable, filterable view of what people are saying about your brand or product, without anyone manually copy-pasting posts at 11 p.m.
Quick setup guide: from social chaos to structured heatmap
Below is a simplified walkthrough of each part of the n8n workflow template and how to configure it. You get all the original technical details, just with fewer yawns.
1. Webhook: catch social data before it scrolls away
First, configure the Webhook node in n8n to accept POST requests from your social ingestion source. This could be:
- Zapier or Make (formerly Integromat)
- Native platform APIs
- Any custom service that forwards social posts
Typical payload fields you want to include:
id– original post idsource– platform name, for exampletwitter,reddit,instagramauthor– username or author idtext– full post texttimestamp– when the post was publishedmetadata– likes, retweets, sentiment, or other optional stats
Example JSON payload:
{  "id": "123",  "source": "twitter",  "text": "I love the new product feature!",  "timestamp": "2025-08-15T12:34:00Z"
}
Once this is wired in, your workflow now has a front door for social content.
2. Splitter: slice long posts into embedding-friendly chunks
Not all posts are short and sweet. Threads, long comments, or combined content can exceed practical token limits for embeddings. To keep things efficient, use a character-based text splitter in the workflow.
Configure it with something like:
chunkSize– for example400characterschunkOverlap– for example40characters
This overlap helps preserve context across chunks so you do not end up with half a sentence in one vector and the punchline in another. Each chunk then goes through the embedding model cleanly.
3. Embeddings: turn text into vectors
Next, the Embeddings node calls OpenAI (or another embeddings provider) to convert each text chunk into a vector representation.
Key points for this step:
- Use a model tuned for semantic similarity, not just generic embeddings.
- Batch embedding calls where possible to lower latency and cost.
- Make sure your API credentials are correctly configured in n8n.
At this stage, your raw social text is now machine-friendly vectors, ready to be stored and searched.
4. Supabase vector store: save embeddings with rich metadata
The Insert node writes each embedding into a Supabase vector store, along with useful metadata that will make your life easier later.
Typical metadata fields to store:
- Original post
id sourceplatformauthortimestampsentiment score(if you have it)- The full chunk text
Use a clear index name such as social_buzz_heatmap so you know what you are querying later. Good metadata lets you:
- Filter by platform or time range
- Build time-based heatmaps
- Slice data for more advanced analytics
5. Query & Tool: semantic search that actually understands meaning
Once your data is in Supabase, the Query node becomes your search engine. Instead of searching for exact words, you search by vector similarity.
This lets you run queries like:
- “posts about login errors”
- “brand mentions about pricing”
The Query node returns the most relevant chunks based on semantic similarity. The Tool node wraps this vector search so that the agent can easily call it as part of its reasoning process.
6. Memory, Chat, and Agent: context-aware insights instead of raw noise
Now for the part that makes this feel smart rather than just technical.
- A buffer window memory node keeps recent interactions or summarized context handy.
- The Chat node (a language model) processes query results and context.
- The Agent node orchestrates tools, interprets results, and outputs insights.
Together, they generate human-friendly summaries such as:
- Trending topics and themes
- Key phrases or recurring complaints
- Representative example posts
- Suggested actions for your team
The agent also decides which insights are worth logging. No more manually deciding which angry tweet deserves a row in your spreadsheet.
7. Google Sheets logging: your living Social Buzz Heatmap log
Finally, the workflow uses a Google Sheets node to append a row for each insight. A typical row might include:
- Timestamp
- Topic tag
- Heat level (for example low, medium, high)
- Representative post URL
- Notes or short summary
Because the data lives in a sheet, you can easily:
- Share it with stakeholders
- Feed it into dashboards or BI tools
- Build visual heatmaps over time
Sample queries to try with your n8n Social Buzz Heatmap
Once the pipeline is running, you can run semantic queries combined with metadata filters to answer questions like:
- “Show me posts about outage or downtime in the last 4 hours.”
- “Identify spikes mentioning ‘pricing’ and return top 10 examples.”
- “Group posts by sentiment and return the top negative clusters.”
By combining vector similarity with filters like source and time ranges, you can focus your heatmap on exactly the conversations that matter.
Best practices for tuning your social listening workflow
To keep your Social Buzz Heatmap efficient and useful, keep these tips in mind:
- Chunk sizing: 300-500 characters with about 10%-15% overlap works well for most social text.
- Metadata hygiene: always include timestamps and platform identifiers to enable time-based and platform-based heatmaps.
- Indexing strategy: periodically re-index or prune old vectors if storage costs start to creep up.
- Rate limits and batching: batch embedding calls to reduce API overhead and keep costs predictable.
- Security: secure your webhook endpoint with signed requests or secret tokens, and keep your Supabase keys protected.
Turning logs into visuals: heatmap visualization ideas
Once your insights are streaming into Google Sheets or a warehouse like BigQuery, you can turn them into actual heatmaps instead of just rows and columns.
Tools you can use include:
- Google Data Studio
- Looker Studio
- A custom
d3.jsheatmap
Useful dimensions for your visualizations:
- Time (hour, day, week)
- Topic cluster
- Intensity (volume or engagement-weighted volume)
- Sentiment breakdown
This is where your spreadsheet of insights turns into a colorful, at-a-glance view of what is heating up across social platforms.
Costs and performance: where the money goes
Most of the ongoing cost in this n8n social listening pipeline comes from:
- Embedding API usage and tokens per call
- Supabase storage and vector query performance
- Language model calls from the Chat and Agent nodes for summarization
To keep your bill under control, you can:
- Sample posts during low-importance windows instead of ingesting everything
- Prioritize high-engagement posts and skip obvious low-signal noise
- Pre-filter by keywords before you send content to the embedding model
That way you get the important signals without paying to embed every single “first!” reply.
How to extend your n8n Social Buzz Heatmap pipeline
Once the core workflow is running smoothly, you can build on it with extra automation superpowers:
- Real-time visualization: push “heat events” to a live dashboard via WebSocket.
- Alerting: trigger Slack or PagerDuty alerts when negative sentiment spikes above a threshold.
- Clustering: run periodic clustering jobs to automatically group posts into topic clusters for your heatmap.
- Feedback loop: let analysts tag results, then feed those tags back into metadata or a classifier to improve future insights.
This is how you move from “we have a dashboard” to “our dashboard tells us what to fix next.”
Quick checklist to launch your Social Buzz Heatmap
- Deploy the n8n template and configure credentials for OpenAI, Supabase, and Google Sheets.
- Secure your webhook endpoint and test it with a few sample POST payloads.
- Tune
chunkSizeandchunkOverlapand select an embeddings model optimized for semantic similarity. - Set up a Google Sheet or connect to a BI tool for visualization.
- Run a pilot for 48-72 hours and adjust filters, thresholds, and alerts based on what you see.
Wrapping up: from social noise to actionable insight
With n8n, OpenAI embeddings, and Supabase, you can build a Social Buzz Heatmap that keeps an eye on social conversations for you. Instead of drowning in noise, you get:
- Semantic search across platforms
- Structured logs in tools you already use, like Google Sheets
- Actionable summaries that help you respond faster and smarter
All without anyone manually screenshotting tweets.
Ready to deploy? Import the template into your n8n instance, plug in your OpenAI and Supabase credentials, and send a few sample social payloads to the webhook. Watch as the heatmap data starts flowing into your sheet. If you want to customize the flow further, you can connect with a consultant or drop a question in the n8n community forums for best-practice tips.